Researchers:
Shikhar Parikh
Abstract:
Algorithmic Trading is the use of algorithms to automate trading of financial instruments with low latency in the microsecond range, to exploit market inconsistencies and create arbitrage situations. Two broad classifications of these algo trading strategies are rule-based technical trading strategies and ML-based strategies. Reinforcement Learning (RL) has become a popular solution for developing algo trading strategies, which involves an agent and an environment where the agent can take actions to interact with the environment. RL agents are trained using trial and error methods to maximize a reward function or minimize a penalty function.
This study explores the use of RL agents to maximize the excessive cumulative return on the DJIA. Four RL agents namely A2C, DDPG, PPO, and SAC are trained using historical data and a combination of eight technical indicators.
Results:
Method:
In the first step, data is visualized and manipulated to improvise it.
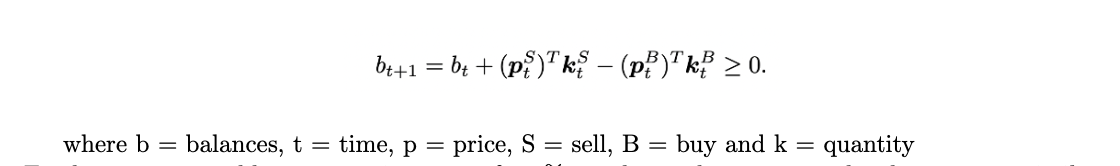
Second step involves simulating the market environment which is done using the following formula.
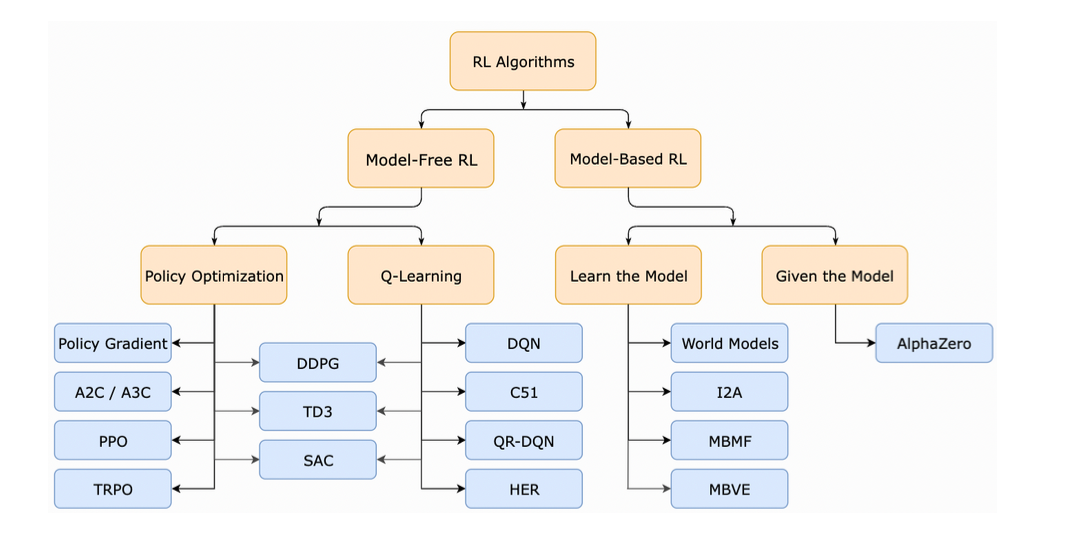
In the last step, the reinforcement learning agent is chosen. For this study, focus is on the model free RL agents which can be also classified into policy optimization and Q-learning. This classification can be better visualized in the figure below:
Back Testing Results:
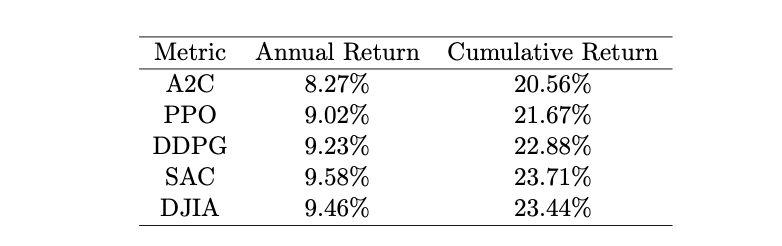
On backtesting the four RL agents, the following results were obtained: SAC outperforms rest of the agents with A2C having the lowest overall annual and cumulative returns, followed by PPO and DDPG. To compare these results with the Dow Jones, the Dow Jones had an annual return of 9.46% for the period and a cumulative return of 23.44%. The results are as shown below:
Since the SAC outperforms the other agents, we will consider only the SAC model for discussing the remainder of the results. The cumulative return of SAC are plotted for the trading duration and compared with the benchmark returns in the following figure:
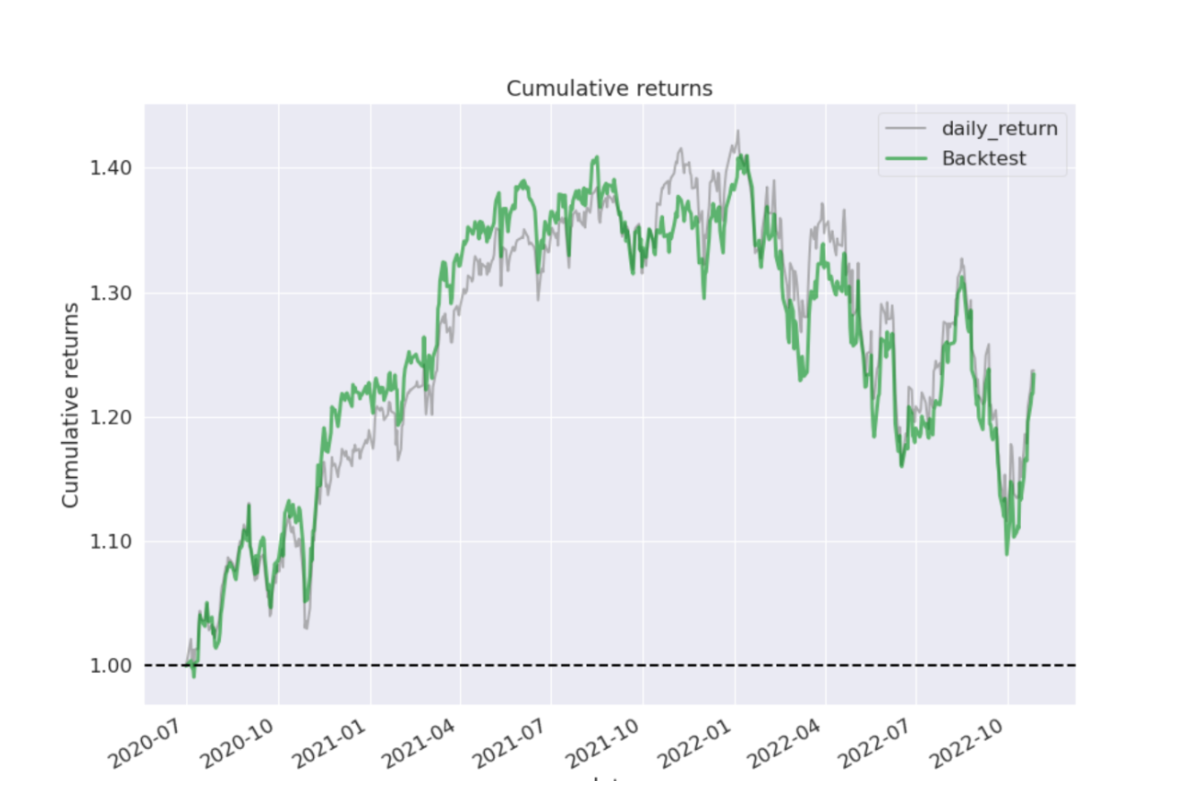
SAC performed well in tracking and outperforming the benchmark during the unprecedented bull run of 2020 and 2021. However, it failed to consistently perform better than the benchmark during market down scenarios in 2022 due to regime changes in the market causing alpha decay. To prevent alpha decay, the SAC agent was re-trained on a market down scenario and evaluated. The trading period (07/20 - 10/22) was split into three periods, with the second period being a re-training phase from Jan 2022. Following figure shows the Gantt chart of the data split:
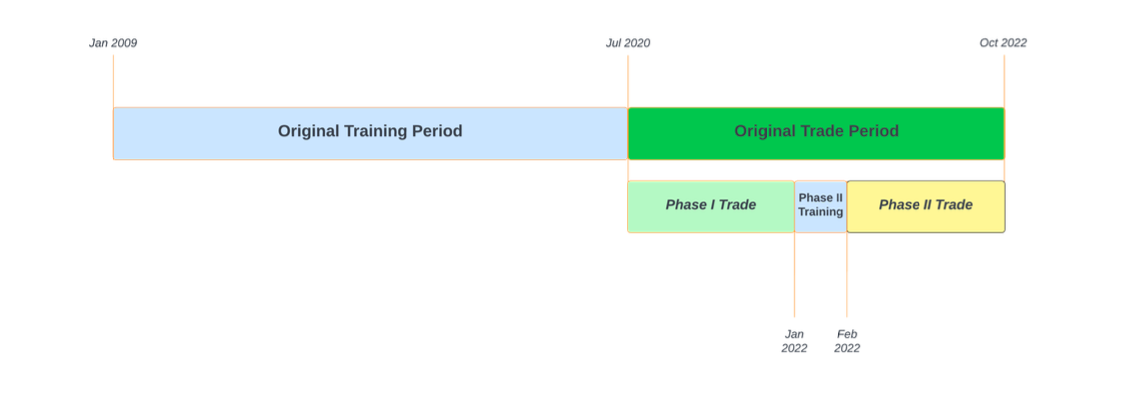
Phase 1 Trading Results:
The performance objective for all the RL agents was to maximize the cumulative return. SAC outperforms the cumulative return of the Dow Jones for the Phase 1 trading period. The results are summarized below:
Phase 1 return sheet is plotted and can be viewed in the following figure:
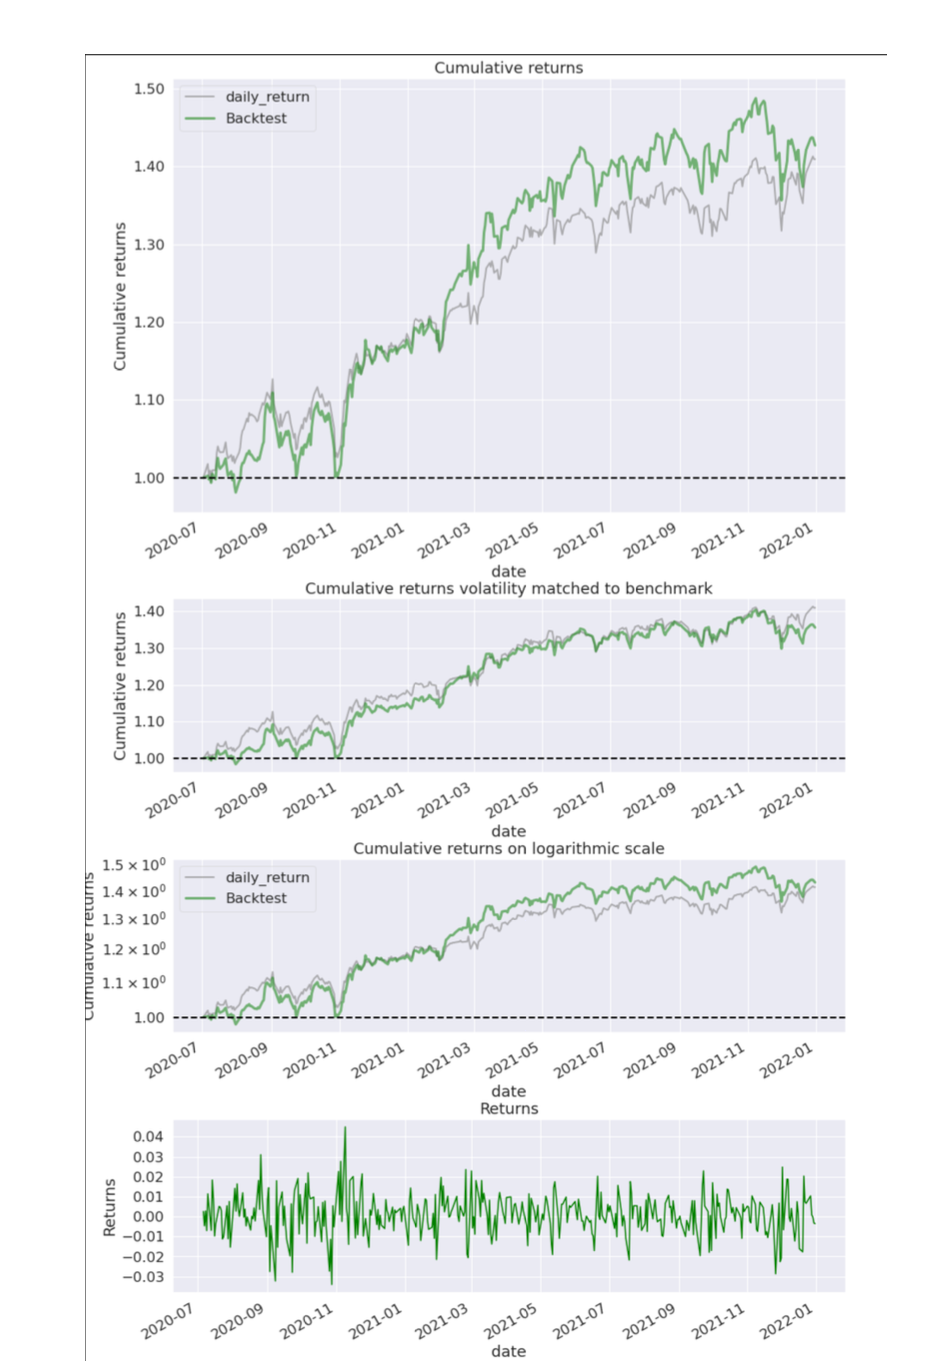
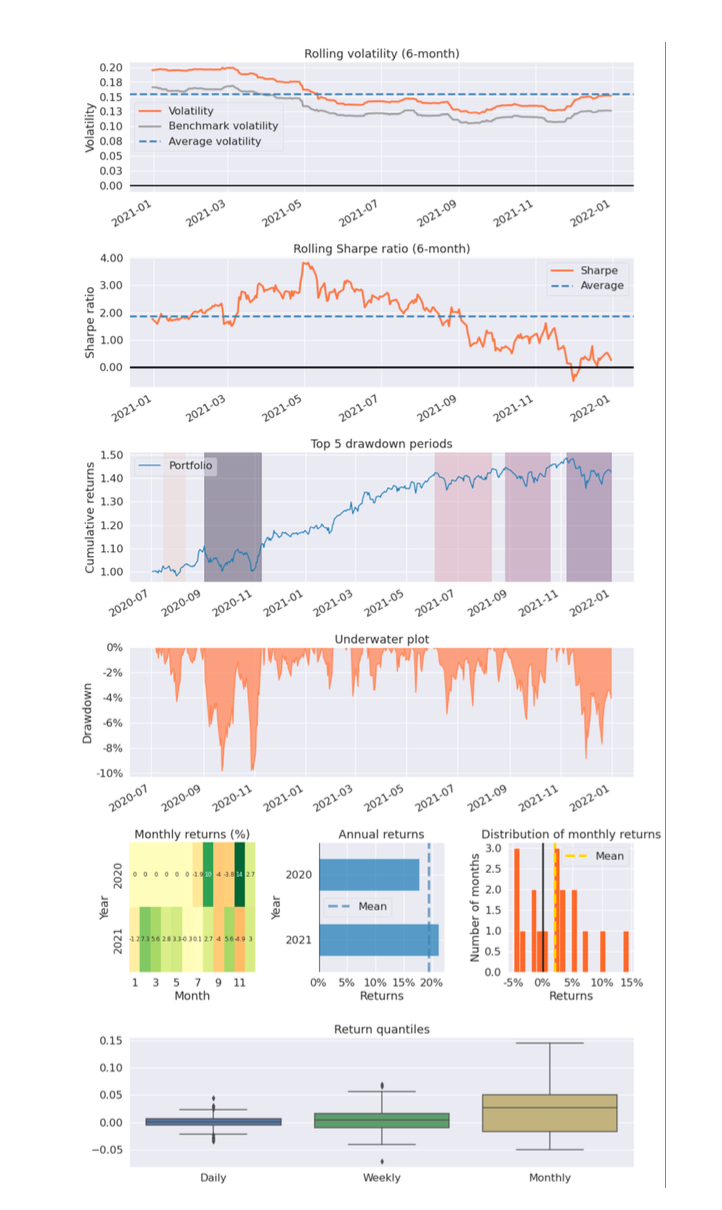
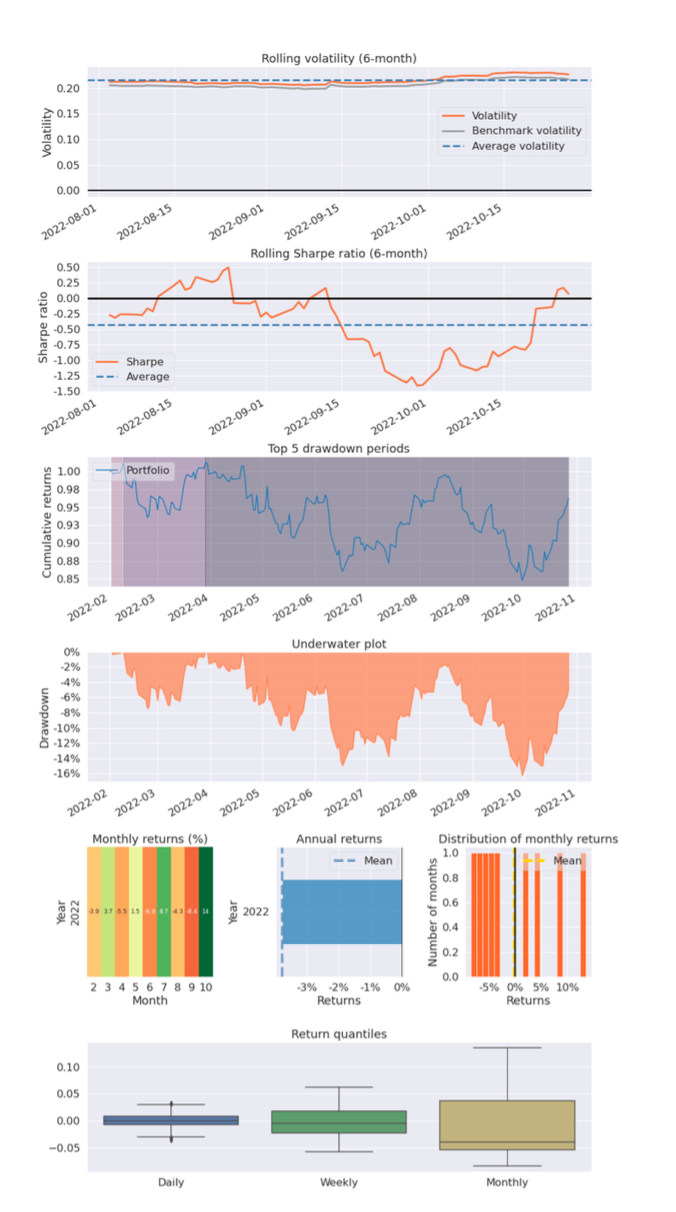
To form better understanding of the strategy, a portfolio tearsheet is created which contains several visualizations explaining the upside and downside risk of any portfolio account value as follows:
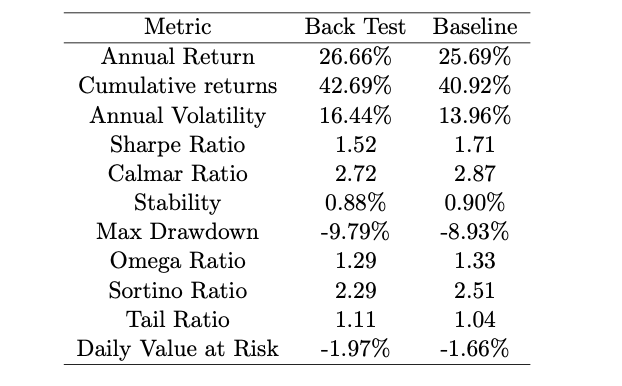
Phase 2 Trading Results:
SAC algorithm outperforms Buy and Hold return of Dow Jones even in market down scenario. SAC had a -5.05% return during the annual -13.39% return of Dow Jones in Phase 2. While both were negative, SAC saved 2x compared to the benchmark. Results may seem poor, but important to note the average retail portfolio is down 30% in 2022 when compared relatively.
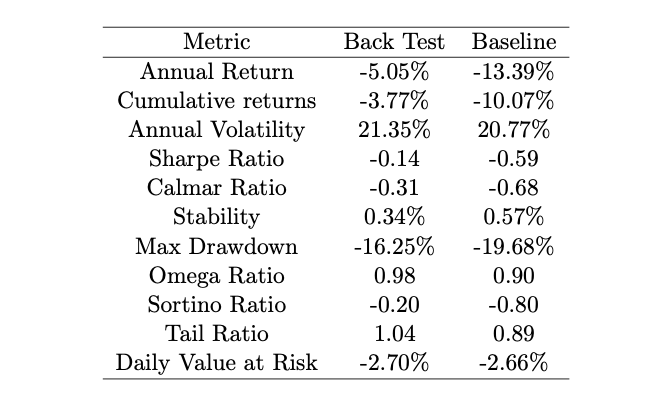
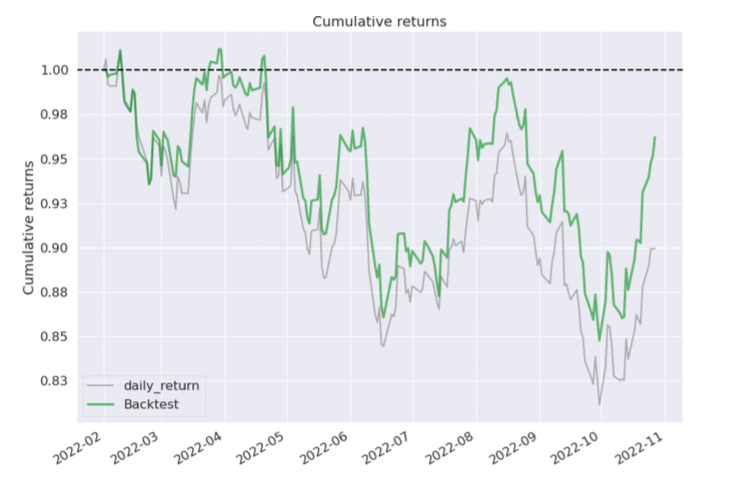
The highlight of the study was SAC performing outstandingly in a market down scenario, outperforming the benchmark by two times in annual returns and three times the cumulative return. Although the strategy had higher annual volatility, the Sharpe ratio and Maximum Drawdown were better than the benchmark. The figure below shows the plot for the performance over time:
The tearsheet of phase 2 is as follows:
Conclusion:
Reinforcement Learning agents can outperform the buy & hold return of a major US Equity Index. It is necessary to periodically retrain the agents. Otherwise, the alpha decay issue arises and the performance of the strategy will continually drop over time. Periodic policy update has the potential to make the strategy agnostic to sudden and violent regime swings. This can be observed in the results obtained during the Phase II trading.
SPX and VIX have had a long inverse correlation, but in 2022 they showed severe decorrelation, leading to inaccurate volatility estimations. RL agents with agnostic behavior to changes in Vega can reduce the need for frequent updates to quantitative models. The stress tests in Phase II are realistic, with SPX Implied volatility curves implying a 2.4% - 3.4% move during additional implied volatility events like rate hikes, aligning with current high-rate environments.