Researchers:
Nan Zhao
Jiali Xin
Fangfang Xue
Faculty Advisors:
Dr. Khaldoun Khashanah
Abstract:
Standard risk measurement approaches like VaR fail to capture systemic risk, posing a challenge to regulators and academics. To address this, a Robo-risk tool using CNN trained machine learning models was developed. Copula functions were introduced to test the performance of the framework with both Gaussian and Non-Gaussian Copulas. Results show that the use of Vine Copula performs better in risk analysis. The tool is flexible and automated to handle longer time periods of financial data. Keywords: Measure Risk, VaR, CoVaR, ∆ CoVaR, Financial Risk, CNN, Machine Learning, Copula Function, Vine Copula, Distribution.
Results:
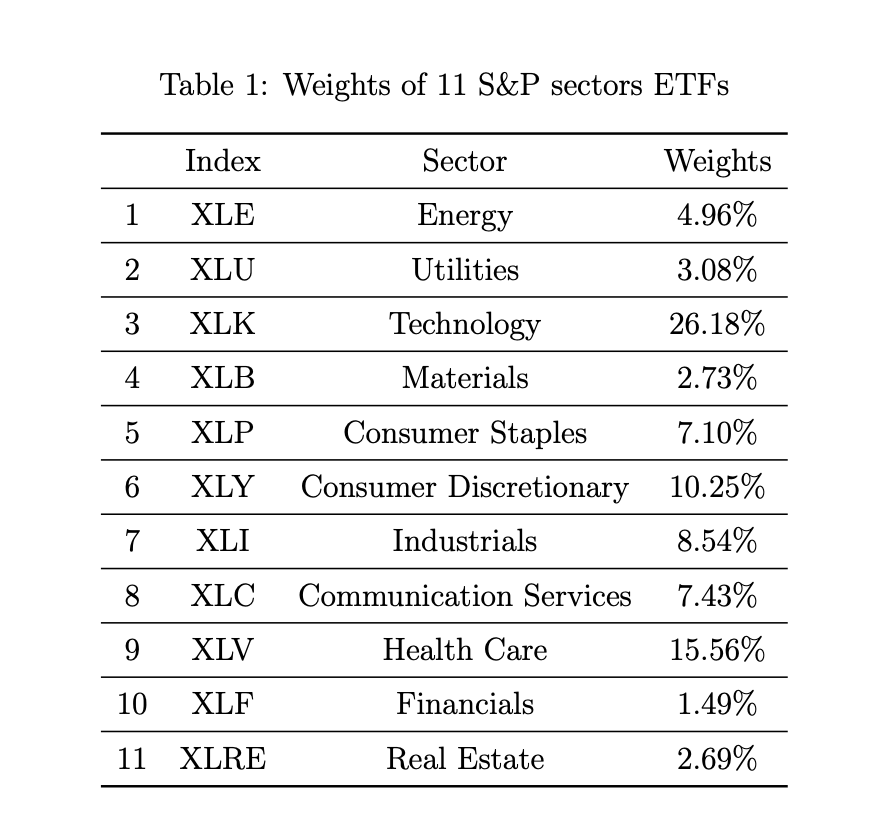
It was decided to utilize the system of 11 S&P select sector ETFs. The weights of each sector are displayed in the table below:
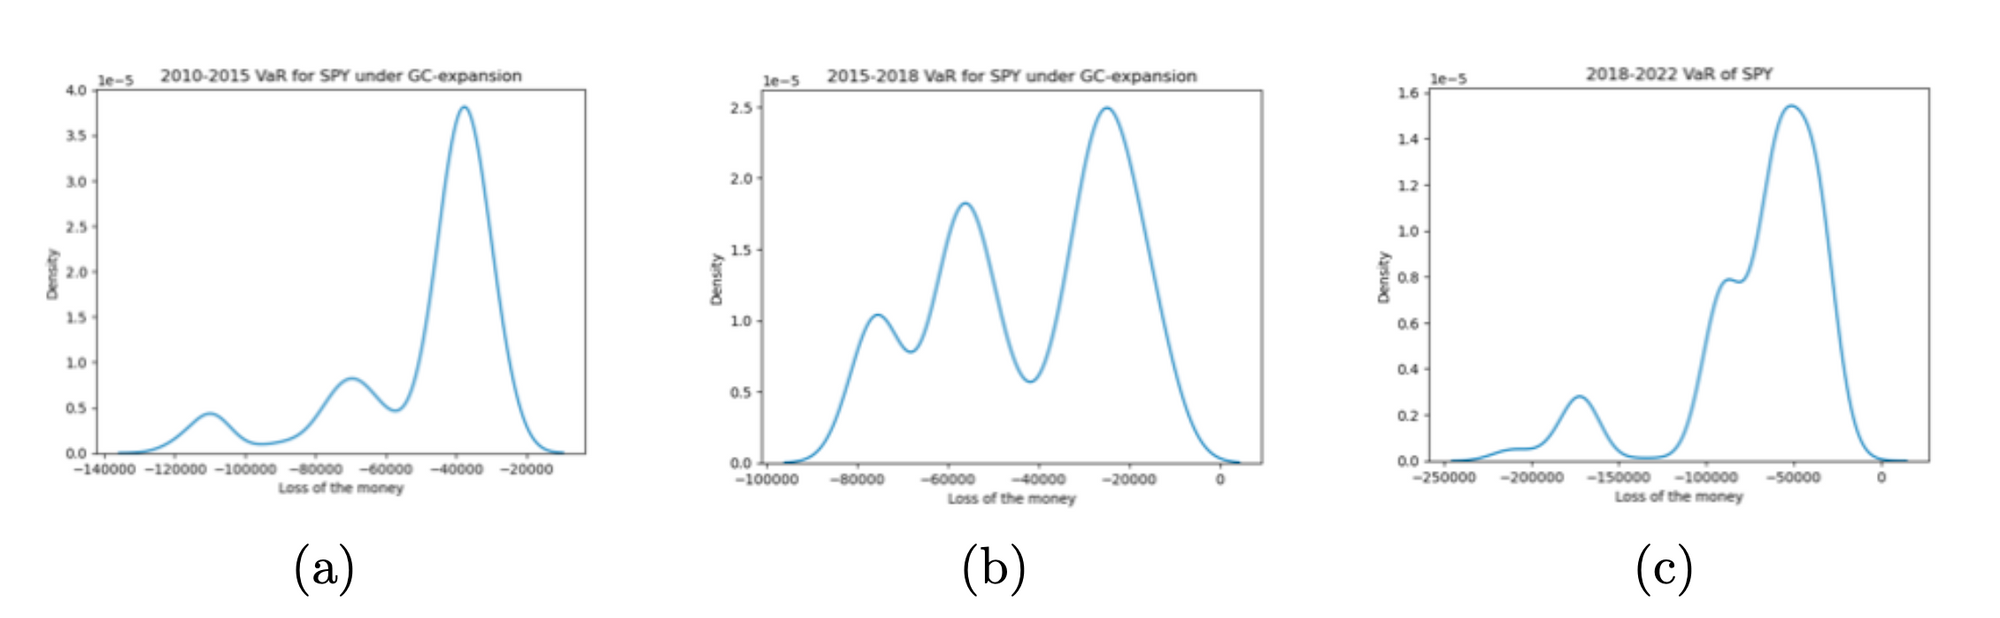
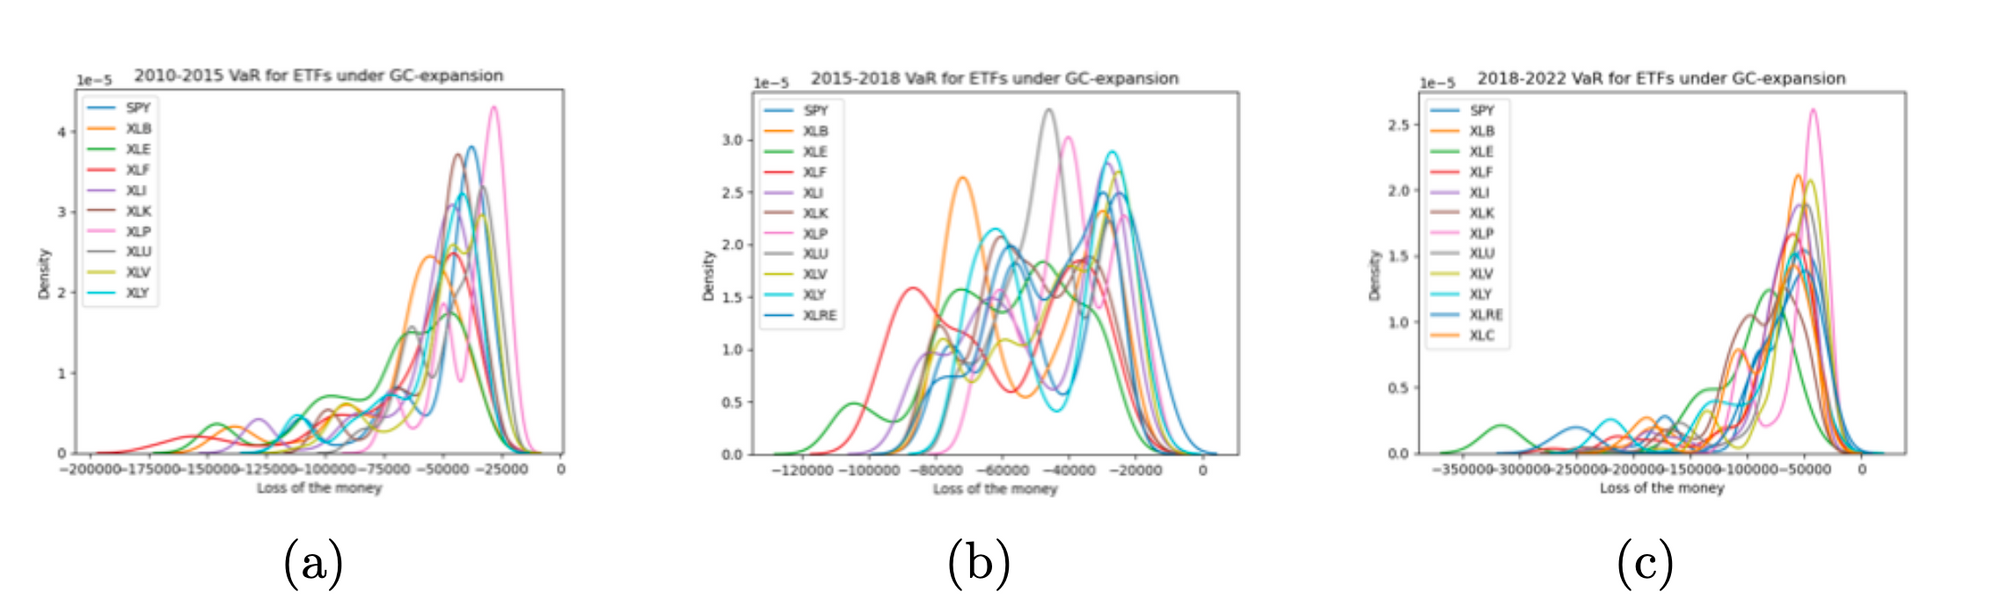
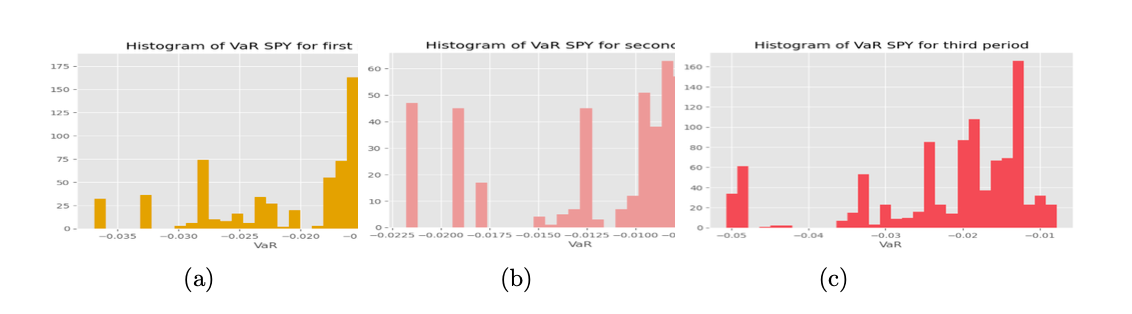
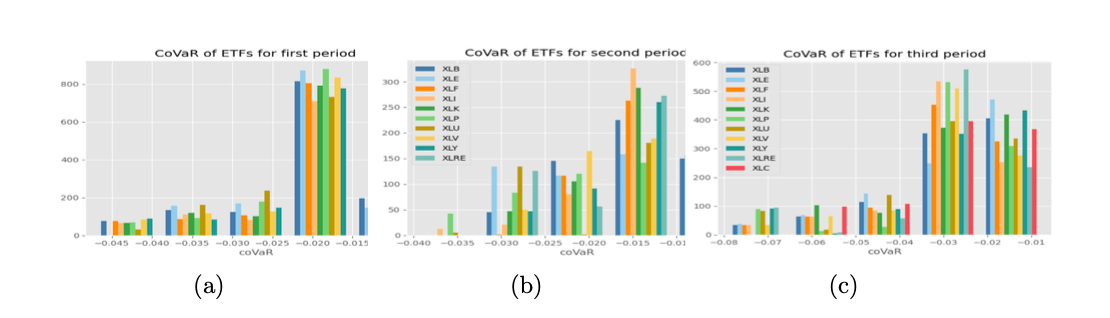
The available data is divided into three time periods to ensure temporal coherence. The first period spanned from 2010-01-01 to 2015-10-18, comprising 9 sectors excluding XLRE and XLC. The second period ranged from 2015-10-09 to 2018-06-19, including XLRE, and the last period covered from 2018-06-20 to 2022-09-30, consisting of all sectors mentioned previously. Machine Learning (CNN) is excluded from the analysis and VaR is calculated for each sector under empirical distribution, visualizing the results due to large numbers. Following first 2 figures show the VaR of SPY and ETFs, respectively. The shorter period showed a heavier tail due to data limitations, while some ETFs in time period 2 showed multi-peaks in distribution.
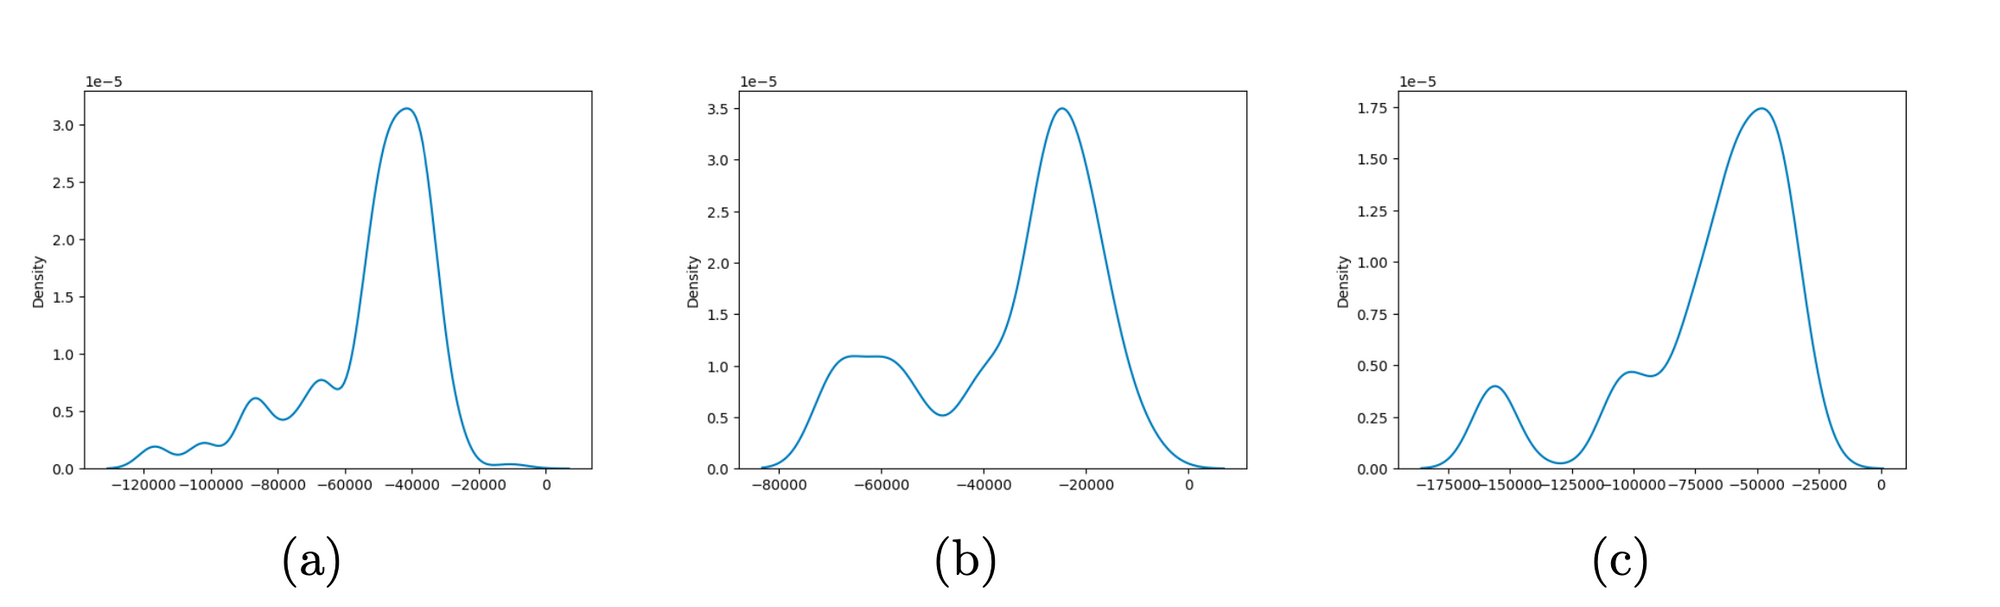
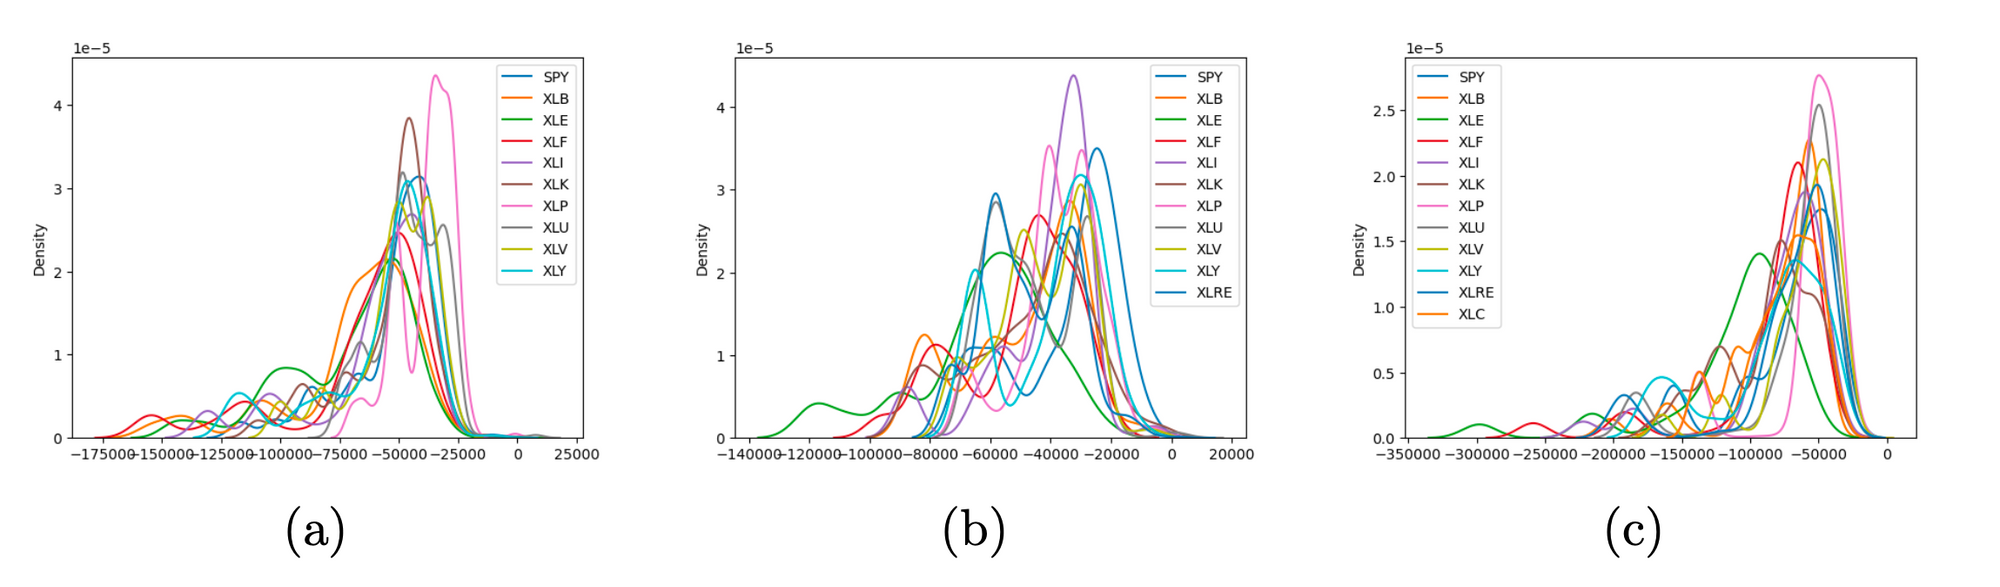
Time period 3 experienced the most significant loss due to the pandemic. VaR is computed under Gram-Charlier distribution expansion, which showed larger losses than under empirical distribution due to its accurate tail risk description.
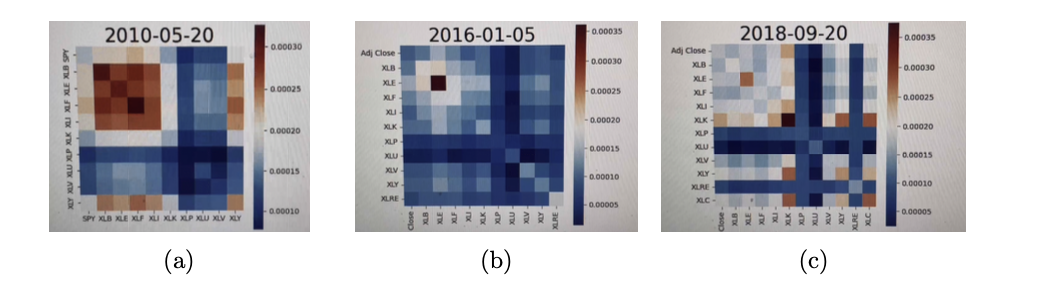
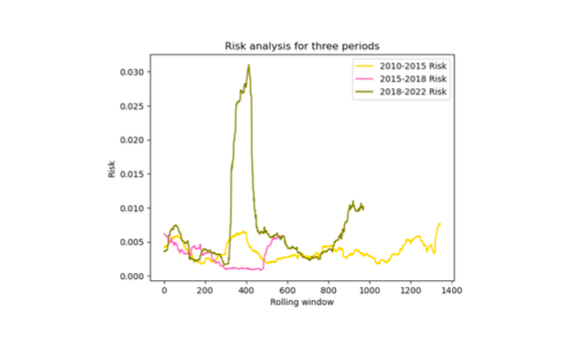
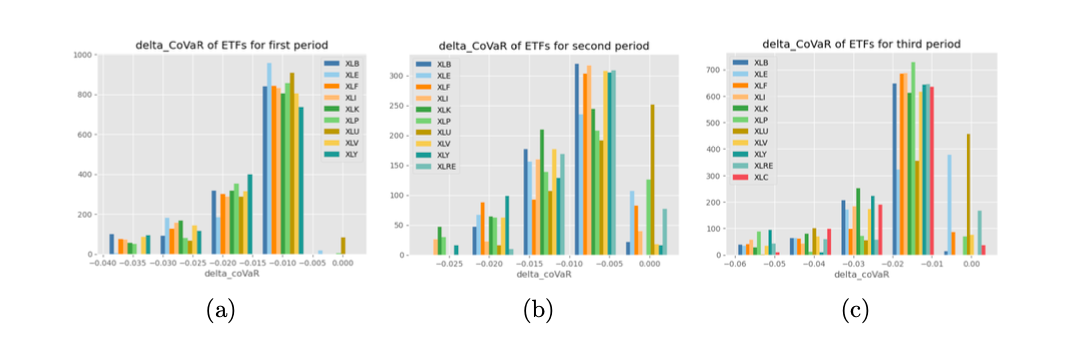
Risk analysis is done for a portfolio of SPY and ETFs using a 100-day rolling window and portfolio optimization to minimize risk. Results show stable risk for first and second periods, but severe fluctuations in the third period. CoVaR is also explored selecting q=0.05, finding CoVaR to be a better measure of extreme risk than simple VaR. Results show concentrated risk values and bigger loss risk in the third period, likely due to COVID-19 across industries. Heat maps and histograms are used for visualization.
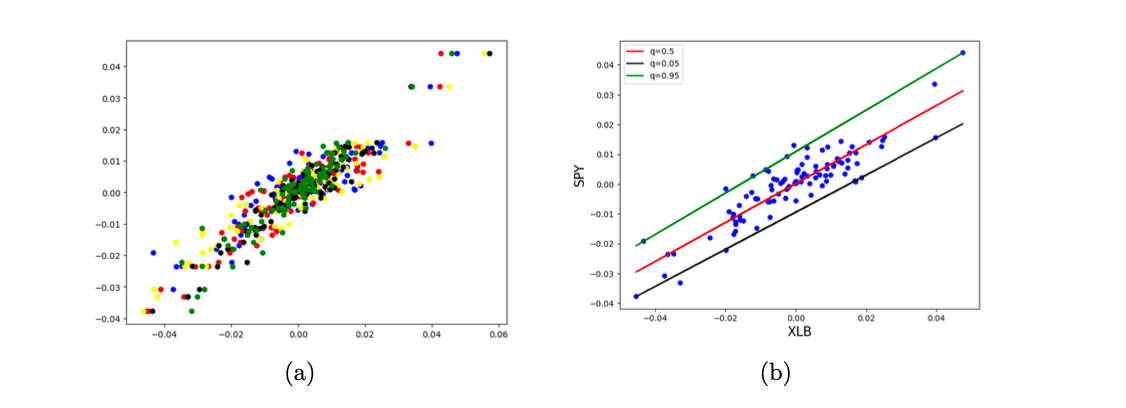
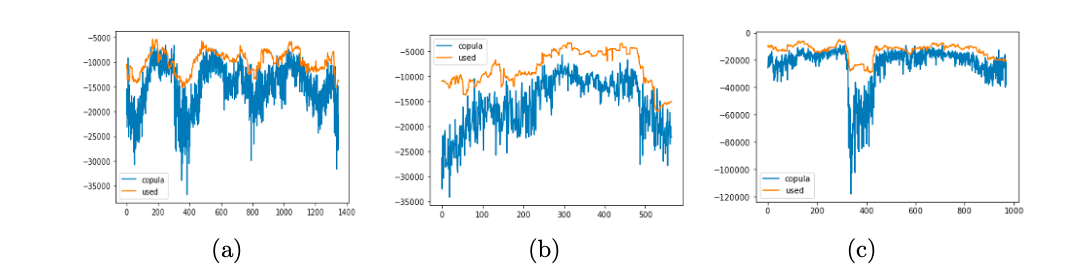
Copula function is introduced to measure risk with VaR, comparing Gaussian and Vine copulas. Results show Vine copula better describes extreme loss:
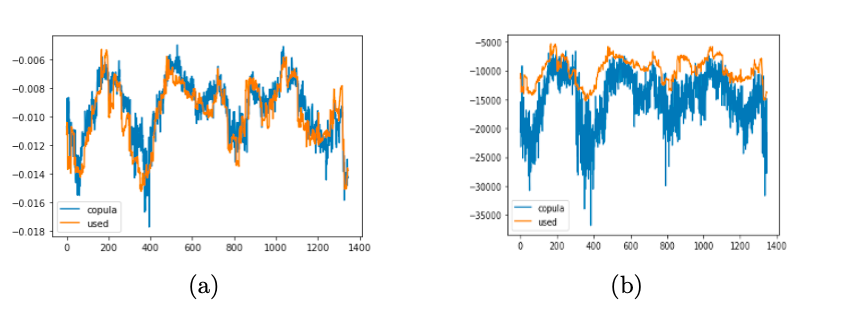
Vine copula is used to calculate risk in each period, with better results than previous risk analysis shown in the previous figure. The results are as follows:
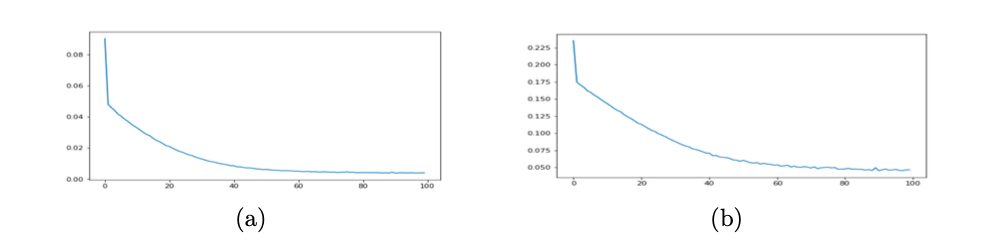
Various risk measurement methods are researched and the project provides reference for qualifying risk. The process is automated using CNN for the first period of 2010-2015, with 70% for training and 30% for testing. Following figure shows decreasing training loss and MSE.
Conclusion:
In conclusion, after exploring various risk measurement methods, it is found that the simple VaR method is inadequate, and advanced methods have been researched and employed, such as CoVaR, portfolio optimization, and copula to improve risk measurement. These methods show better results than the simple VaR method, fulfilling the research goals. Although only one machine learning method is implemented due to time constraints, the overall method shows promise, although it cannot be said to be an exact representation of the real world. In summary, this project provides a means of measuring financial risk that is important for those working in finance.