Researchers:
Anand Patel
Faculty Advisors:
Dr. Ionut Florescu
Dr. Zhenyu Cui
Abstract:
The research into credit rating modeling and modeling of other credit or default-related measures which were done previously were dependent on data derived from the information recorded on financial statements of the companies. This is done only once in three months. But since the market operates daily, this project develops a model using random forest regression. It models and predicts a company's default probability on a daily basis using factors available more frequent than once a quarter. We also generate a portfolio and create a profitable trading strategy using this model which creates signals based on changes in the company's default probability. Even though the model is expected to help recognize companies on the verge of financial distress and are capable of making returns by shorting stocks, the trading strategy earns most of its profit from long positions in investment-grade companies which are more stable financially.
Results:
Modeling
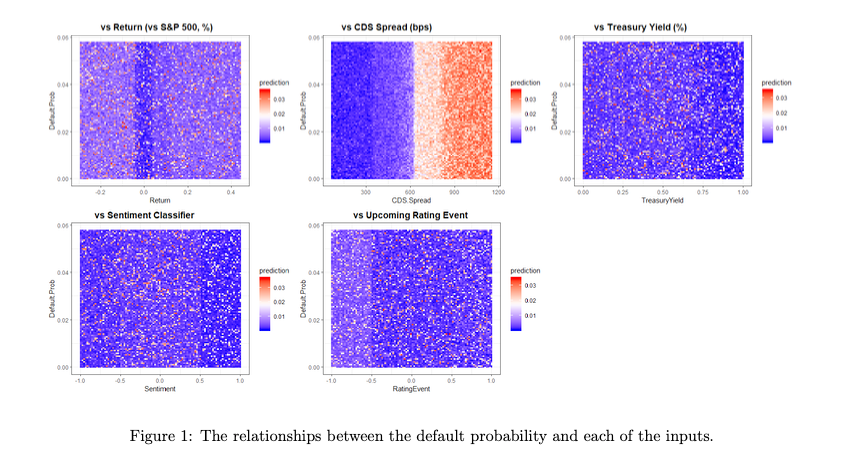
From 107 technology companies till date, 90 companies were used to create the model. The grid of plots below shows the predicted default probability (both in- and out-of-sample) across an array of values for each of the inputs, where red indicates higher probabilities of default, and blue corresponds to lower prediction.
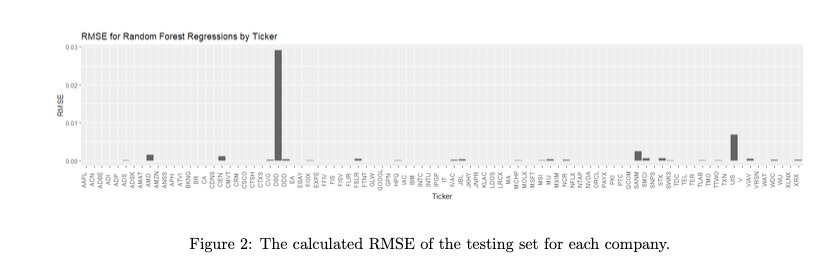
To ensure that the models are accurate and perform well, the root mean squared error is calculated for each stock using its out-of-sample predictions, with the results as follows.
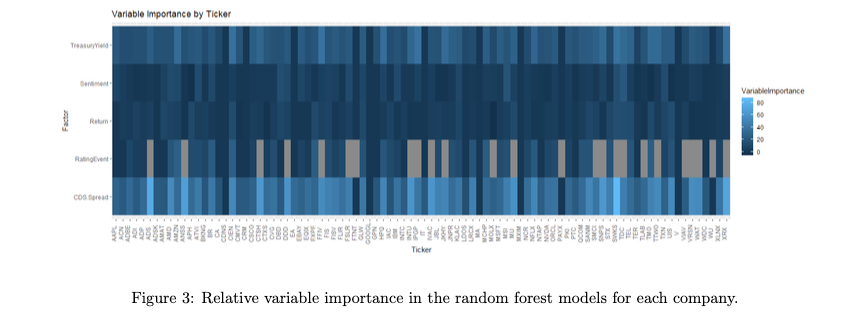
The chart below shows the relative importance for each of the model inputs, with lighter colors being more important and vice versa. Most companies' default probability was primarily predicted by the credit default swap spread, followed by Treasury Yield and other factors. Gray spots in the RatingEvent input line indicate that credit ratings were not available and were therefore not included in the model.
Trading Strategy
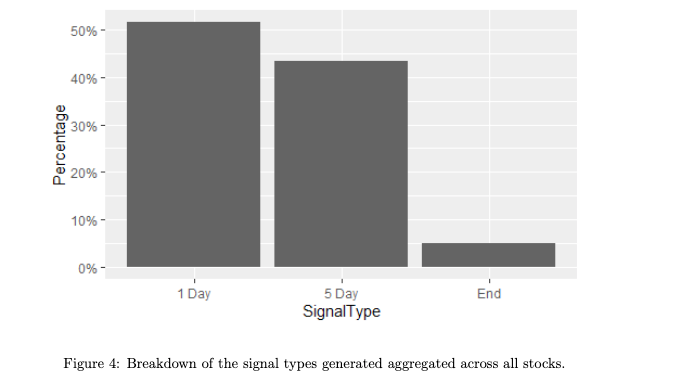
Using following model for trading, it was found that no signal type dominated, with about half of trades coming from sharp changes and 43% from gradual changes. 5% of trades closed due to lack of opposite signal at end of data.
Portfolio return was 58.29%. Limitations due to data availability resulted in almost zero returns from 2004 to 2014. Portfolio underperformed the market's 206.51% return over the same period.
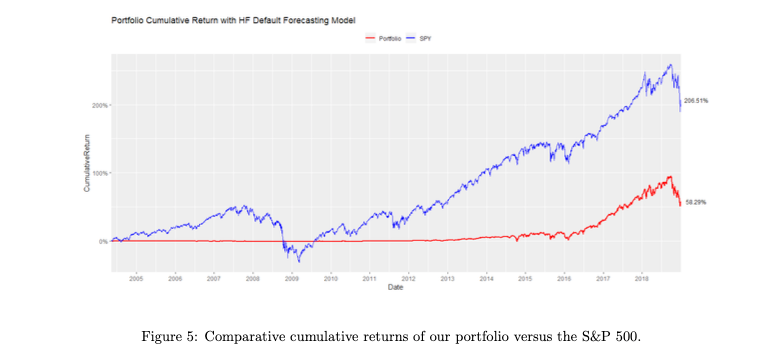
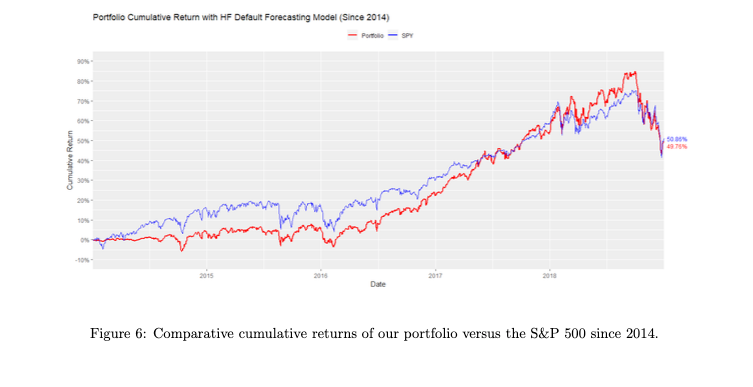
Portfolio initially underperformed due to limited trading of modeled stocks from 2004-2014. Returns later accelerated and outperformed the market until late 2018 when it decreased in value faster. 70 of the companies had positive returns, with Nvidia and Take-Two Interactive as top performers. AMD was more actively traded and returned 220.11%. Losers were mainly those with few positions, including CMVT and QCOM, while DBD had the highest error and ultimately lost 61.30% in value.
The returns of the portfolio's investments are analyzed by rating category and position type, revealing which ones are contributing or hindering returns. The table displays average returns per position for investment-grade, high-yield, and unrated stocks, and for long and short positions.
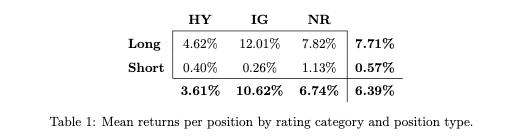
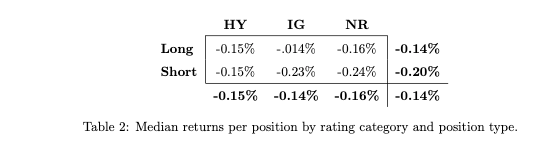
Contrary to the anticipation of greater profits from financially unstable companies with low stock prices (i.e. high yield rating and short positions), the results present a marked contrast. Majority of the returns come from investment-grade firms, and long positions outperform short positions by a significant margin. Short positions, in fact, yield a meager profit on average. Median returns can also be examined based on the same criteria for further insights:
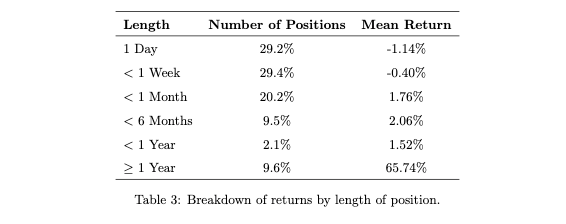
80% of the positions lasted under a month and didn't make a profit. Majority of gains are from positions held for over a year, averaging 3.16 years. Out of 83 such positions, 63 were closed on the last day with 67.7% average return. Likely because the strategy profited from tracking the bull market within the available data.
Conclusion:
Default probability can be modeled using daily data by considering factors such as return, CDS spreads, company sentiment, credit rating changes, and Treasury yields. This outperforms models that rely on quarterly financial statements. Although our profitable trading strategy did not consistently beat the market, most returns came from financially stable companies, contrary to our initial hypothesis of identifying and shorting struggling companies. Nonetheless, accurately modeling a company's financial health remains important, and with improvements in relevant data, the models can become more accurate, making the trading strategy more profitable.