Researchers:
Feihan Bian
Yujun Geng
Supervisor:
Dr. Cristian Homescu
Abstract:
The project focuses on constructing a regime-dependent multi-asset portfolio for asset allocation, using statistical and econometric methods such as Markov Switching Model (MSM) and Hidden Markov Model (HMM) to identify market regimes. The portfolio is constructed using mean-variance optimization and model predictive control (MPC). Results show that the regime-dependent mean-variance portfolio outperforms the traditional portfolio in terms of both risk and return, and that MSM-MPC portfolio construction produces the best portfolio. The MSM model is found to be better than the HMM model.
Results:
1. Markov Switching Regime Detection
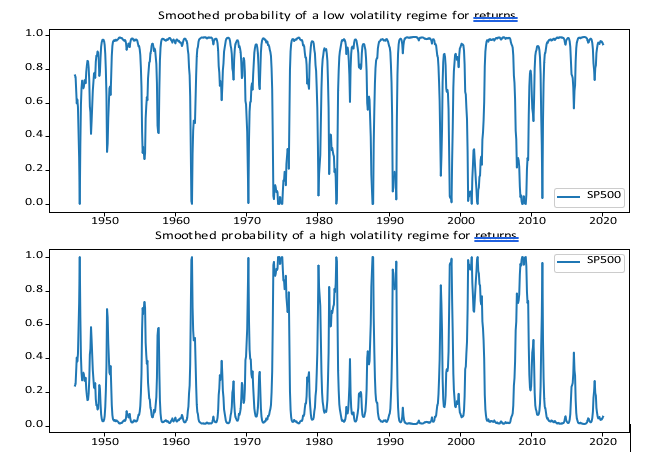
The two-regime model captures some periods of stress, but loses granularity in regime detection. For example, it considers the early to mid-2000s a period of high volatility, which may not accurately reflect market behavior. Therefore, a three-regime model is considered for improved granularity.
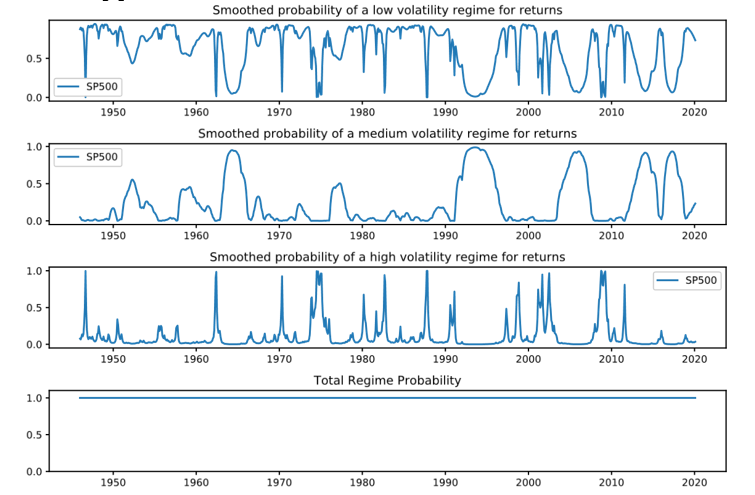
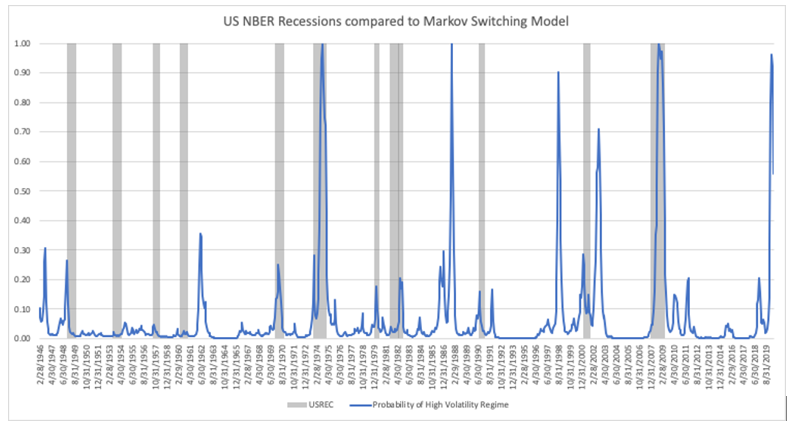
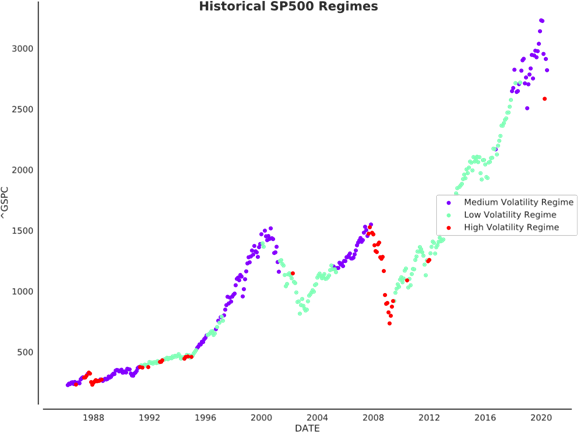
The three-regime model provides more clearly defined periods of high volatility that align with historical periods of market stress. The regime probabilities sum to one, confirming the model's validity. Comparison to the NBER business cycle can confirm suitability for regime detection, as seen in below figure where the high volatility regime is compared to NBER recessions.
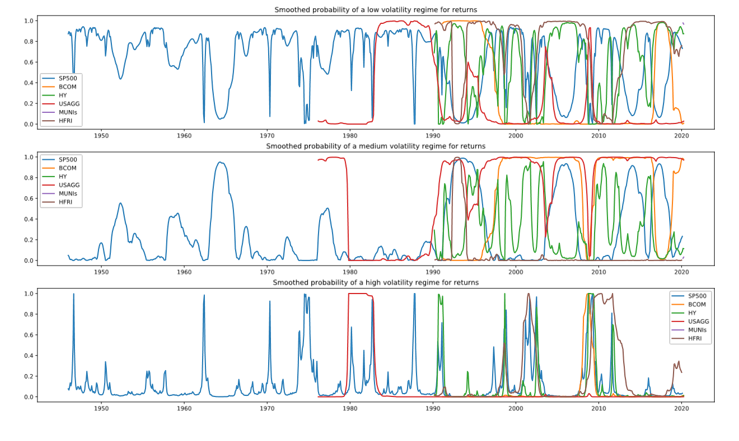
The three-regime MSM identifies similar regimes across all asset classes, indicating that the model captures the broad economic backdrop. However, differences in regime may be due to index construction or underlying instrument liquidity. Asset returns during each period can be analyzed to determine how risky assets perform in high volatility regimes. Table shows the returns for each period.
|
Period |
S&P
500 |
T-Bonds |
USAGG |
HY |
MUNI |
BCOM |
HFRI |
|
Full Period |
.652% |
.640% |
.601% |
.784% |
.553% |
.018% |
.764% |
|
Low Vol |
.872% |
.695% |
.667% |
1.056% |
.621% |
.440% |
.729% |
|
Medium
Vol |
.947% |
.444% |
.403% |
.846% |
.415% |
.062% |
1.047% |
|
High Vol |
-2.914% |
1.267% |
.769% |
-1.294% |
.550% |
-2.985% |
-.561% |
2. Hidden Markov Model Regime Detection
For comparison, a three-regime HMM model is considered alongside the three-regime MSM model for regime detection. The S&P 500 returns are analyzed, and Figure 5 shows the S&P 500 price with identified regime.
The identified regimes in the HMM model are similar to the MSM model, but with some concerns. The HMM model appears less stable than the MSM model, with instances where the S&P 500 is in a high volatility regime for only one month before returning to a low volatility regime, as in 2012. Table 3 displays regime-dependent returns for each asset in the HMM model.
|
Period |
S&P
500 |
T-Bonds |
USAGG |
HY |
MUNI |
BCOM |
HFRI |
|
Full Period |
.652% |
.640% |
.601% |
.784% |
.553% |
.018% |
.764% |
|
Low Vol |
.771% |
.549% |
.351% |
.858% |
.386% |
.161% |
.982% |
|
Medium
Vol |
.393% |
.715% |
.556% |
.524% |
.524% |
.330% |
1.262% |
|
High Vol |
-1.464% |
.967% |
.577% |
-.040% |
.467% |
-1.664% |
.400% |
Both the HMM and MSM models show similar behavior in moving from risky assets to less risky ones during high volatility regimes, but there are some concerns. The HMM model's performance of high yield bonds is not as expected. A direct comparison between the S&P 500 regimes of the two models shows that the MSM model is more stable, and the models disagree on the occurrence of medium variance regimes. Both models will be used for portfolio construction.
3. Mean-Variance Portfolio Performance
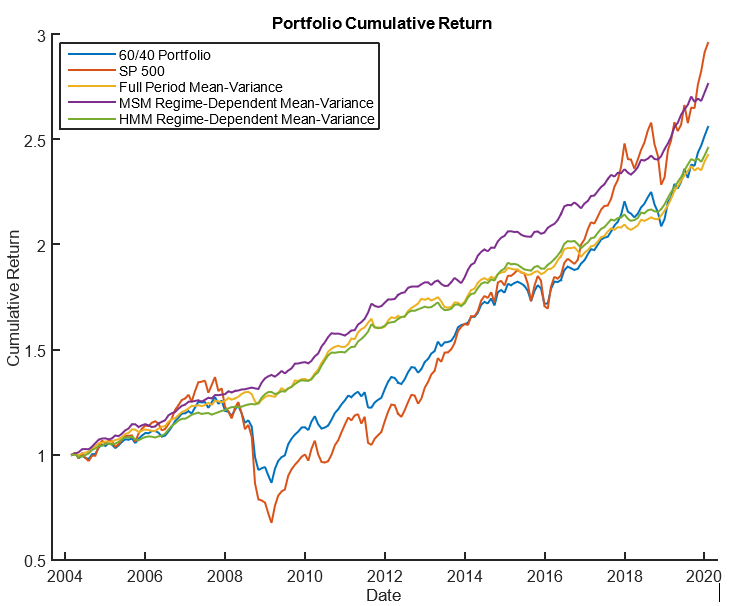
To analyze regime-dependent mean-variance portfolios, benchmarks and performance metrics are determined. Benchmarks include a 60/40 portfolio and a mean-variance portfolio, and performance metrics include cumulative return, Sharpe ratio, three-month maximum drawdown, and Value-at-Risk.
Figure below shows a comparison of the cumulative return for the S&P 500, 60/40 portfolio, full period mean-variance portfolio, MSM regime-dependent mean-variance portfolio, and HMM regime-dependent mean-variance portfolio from 2004-2020.
|
Portfolio |
Sharpe |
Monthly
VaR |
Max Draw
Down |
Volatility |
|
60/40 |
.2397 |
37.22% |
32.20% |
7.47% |
|
Full
Period MV |
.6392 |
.82% |
3.8% |
2.68% |
|
HMM Regime |
.6806 |
.70% |
2.14% |
2.59% |
|
MSM Regime |
.7074 |
.68% |
1.45% |
2.37% |
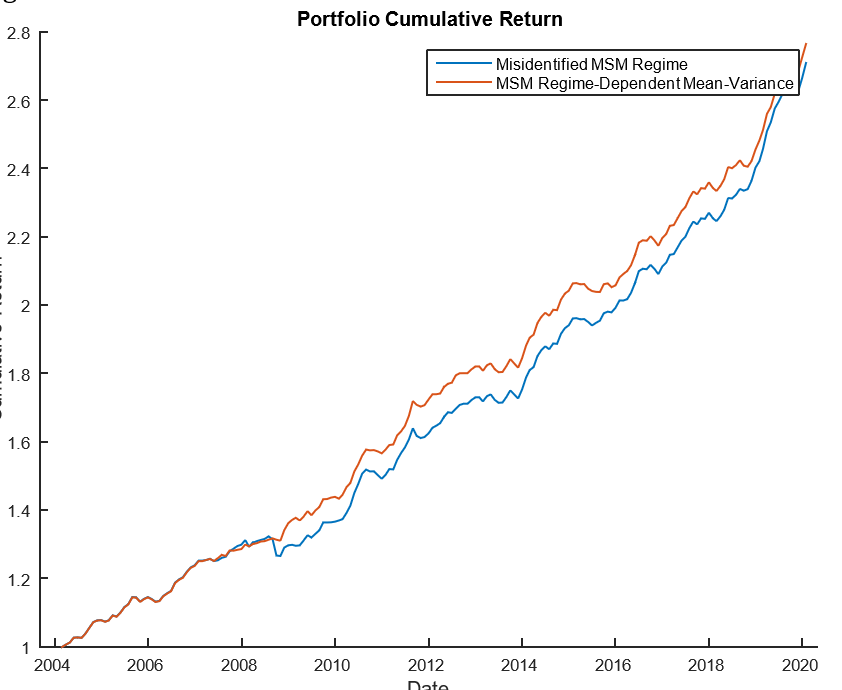
Regime-dependent portfolios improve risk performance compared to traditional ones. MSM portfolio quickly switches out of risky assets. Misidentifying a regime leads to underperformance. Effective regime identification is crucial for superior cumulative return.
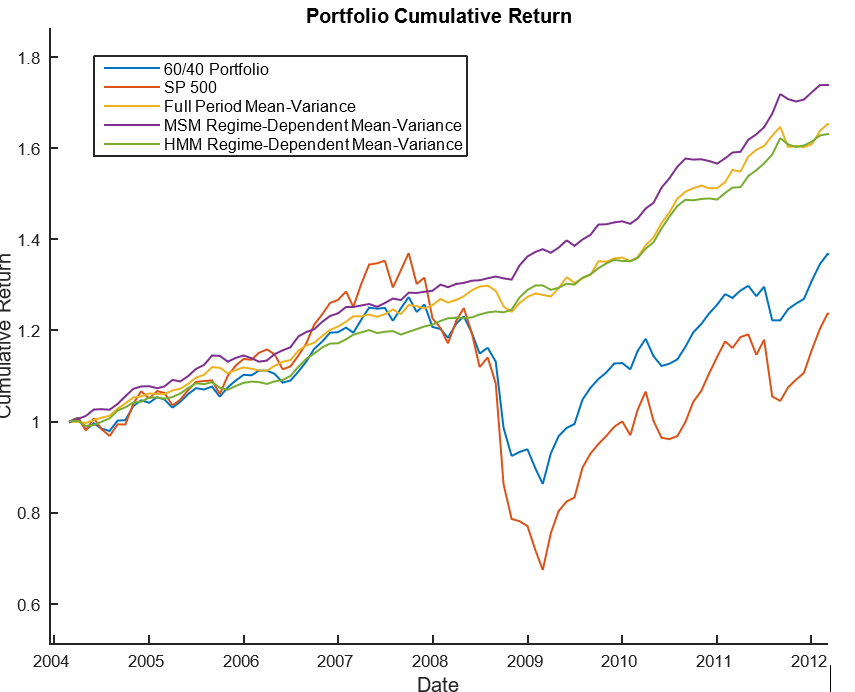
MSM portfolio quickly switches to safer assets and outperforms HMM due to initial outperformance in medium volatility regime. Misidentifying regime leads to underperformance as shown in the figure below.
4. Model Predictive Control Portfolio Performance
Consider MPC portfolio construction, which uses the full probability distribution of states for a more conservative portfolio. Using the MSM distribution, we compare its performance with previous mean-variance portfolios in figure below.
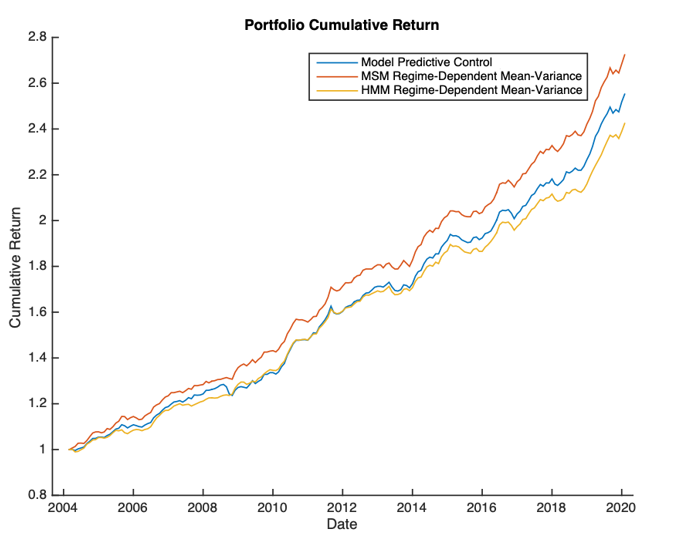
MPC portfolio's cumulative return is lower due to high risk aversion parameter, but its Sharpe ratio and risk metrics are improved compared to the MSM mean-variance portfolio, as shown in the give table
|
Portfolio |
Sharpe |
Monthly
VaR |
Max Draw
Down |
|
MSM MV |
.7074 |
.68% |
1.45% |
|
HMM MV |
.6806 |
.70% |
2.14% |
|
MPC MSM |
.7102 |
.61% |
1.36% |
MPC portfolio considers full distribution of state probabilities, resulting in a more conservative allocation but lower return. It shows potential in asset allocation.
Conclusion:
Regimes are important in asset allocation and identifying them is vital. The Markov Switching Model and Hidden Markov Model outperform traditional methods, with MSM performing better. Misidentifying a regime can lead to an inferior portfolio. Considering the full distribution improves risk performance.
In conclusion, regime-based investing shows promise in terms of portfolio risk and return characteristics. Further research could explore the regime performance of investment managers or styles, investigate regime dependence of different factors, and develop a model to predict future states incorporating market and macroeconomic factors. These research areas could enhance portfolio construction by accounting for future states, improving optimization, and reducing the reliance on assuming the current state will persist.