Researchers:
Eric Mozeika
Andrew Shields
Dheemanth Sriram
Supervisor:
Dr. Cristian Homescu
Abstract:
The study examines the use of Machine Learning (ML) in financial markets, focusing on empirical asset pricing to understand its potential benefits compared to classical asset pricing models. Different ML models are tested using various market data sets, including industries, stocks, and commodities. A backtesting framework is used to assess each model's forecasting ability and its impact on portfolio performance. The study is divided into two parts, evaluating the models' accuracy in making forecasts and their ability to create better portfolio returns compared to classical models. The analysis also explores ways to enhance the models' accuracy to improve portfolio performance.
Results:
1. Foundational analysis
The results section starts with using lagged returns as predictors for other industries and testing various ML models. Interesting results were obtained from this experimentation.
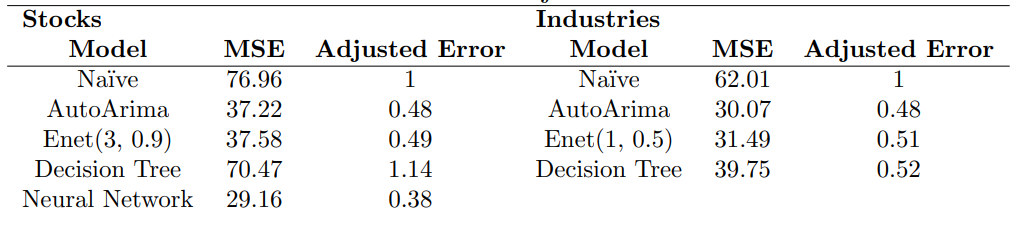
2. Comparative Analysis of Forecasting Errors
To analyze forecasting errors, a method similar to M4 competition was used. Adjusted errors were calculated by dividing the model's MSEs by the MSE from a Naive approach. ML models outperformed Naive approach, but not Auto Arima models, suggesting that additional information is needed to improve ML models.
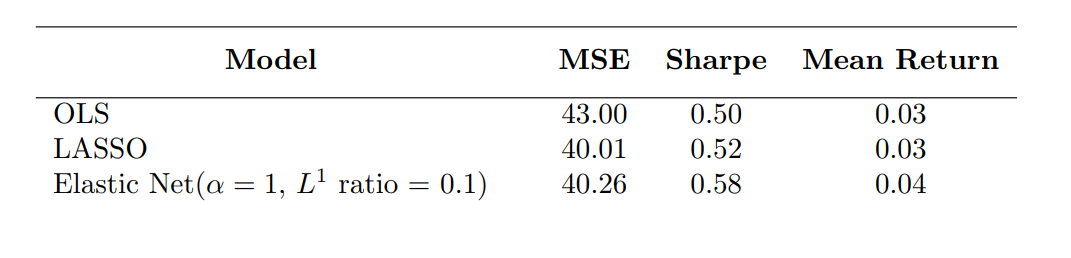
3. Returns-Based Features
To improve our models, additional features were added to capture more information on asset returns. However, results did not show a significant improvement over the original less-complex model, which was surprising since literature suggests that these characteristics offer better results. Testing different types of data was explored to see if more granular data would offer better results.
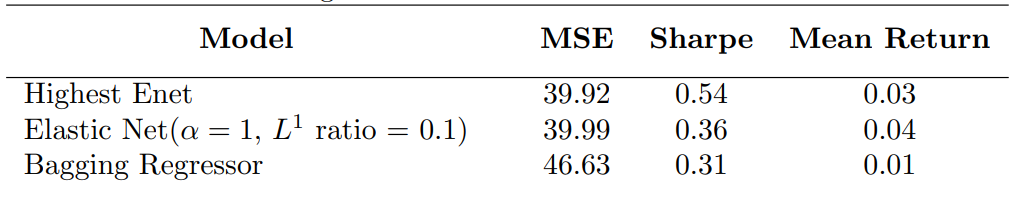
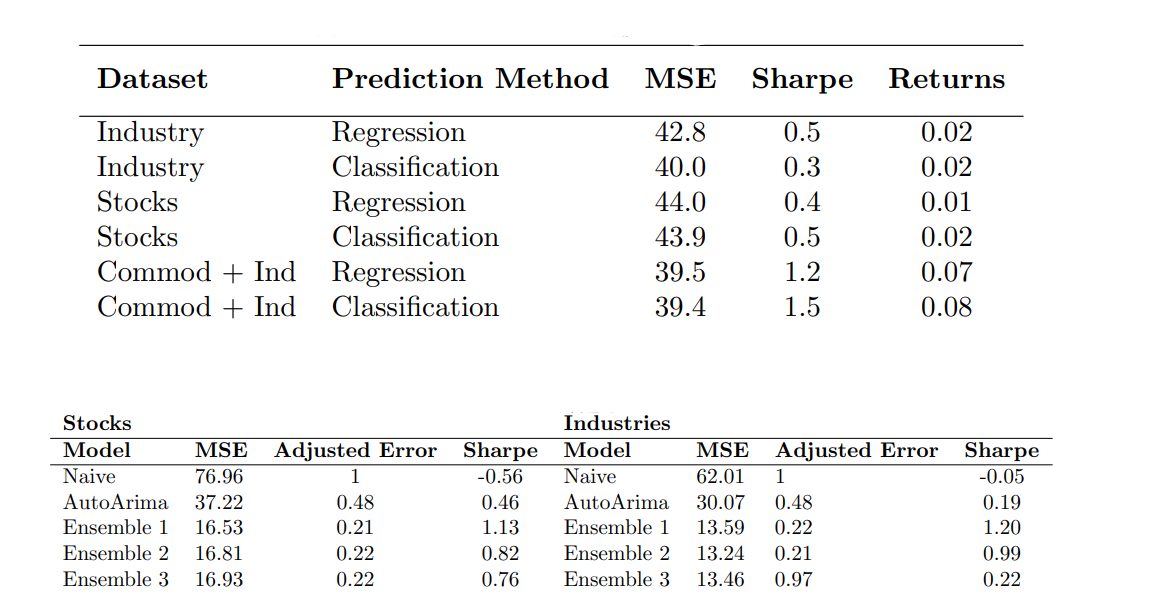
4. Different ML Methods
A stacking ensemble method was implemented along with statistical forecasting methods to reduce multicollinearity effects. Results showed a significant improvement in reducing MSE and increasing Sharpe ratios, making it a breakthrough as many models were not able to improve forecasting and portfolio measures simultaneously.
5. Benchmark Analysis
Active managers aim to outperform benchmarks, providing better returns and lower volatility for investors. The authors compare their strategy to the SPY and Fama French momentum index, and their models outperformed both benchmarks in terms of risk-adjusted returns, which is a compelling result.
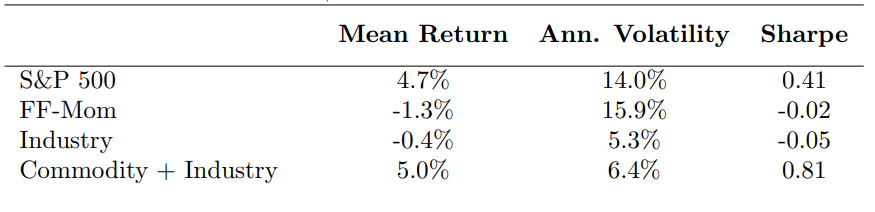
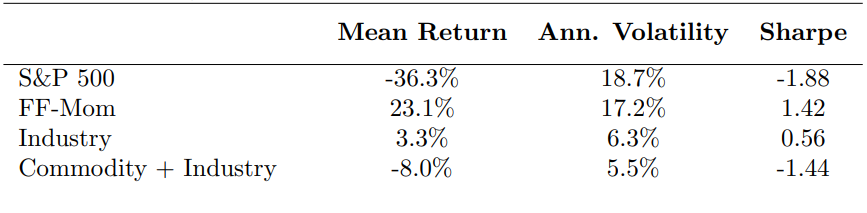
6. Market Regime Analysis
The investment strategy performs well over time despite the model's predictability faltering during periods of high stress. During the 2008 financial crisis, the strategy combining Commodities and Industries lost just shy of 7% and realized a volatility of less than a third of the broader market, while in the period after the crisis, the model adjusted to predict returns based on which type of momentum should perform better.
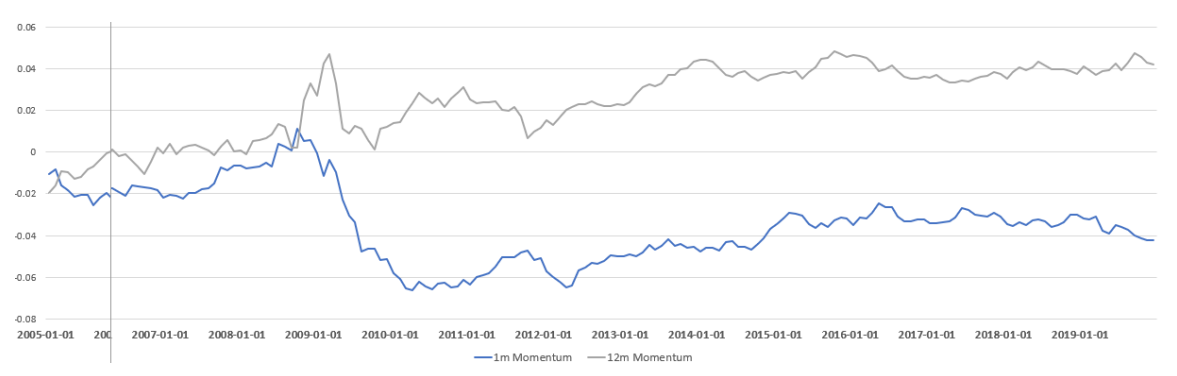
7. Feature Importance Analysis
Some papers offer ways to interpret the variables in neural networks, such as using gradients and Hessians of estimated probabilities. The authors conducted limited analysis on industries and found that predictor variables displayed a significant amount of time variation, and their coefficients modulated throughout time. They also found that short-term momentum had a negative coefficient on average, while 12-month momentum had a positive coefficient on average. The behavior of these variables coincided with the momentum crash that happened in 2009.
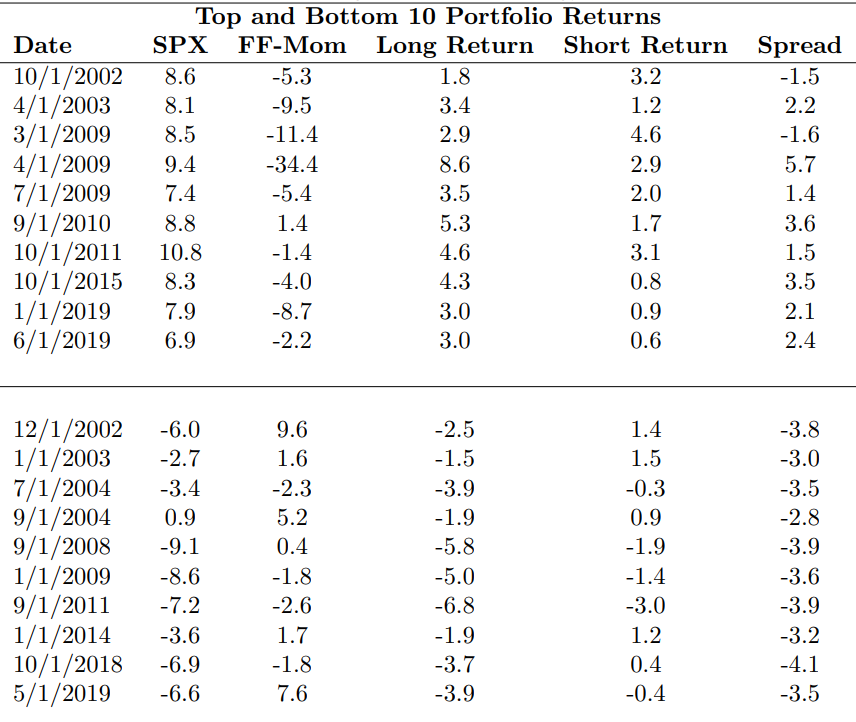
8. Performance Driver Analysis
Decomposing the returns of long and short legs of a portfolio is an interesting way to evaluate performance. The Commodity + Industry portfolio showed positive returns in 134 out of 216 months, with the long leg driving most of the performance. The strategy avoided momentum crashes but performed poorly during market crashes, suggesting the need for higher-frequency market state predictor variables in the future.
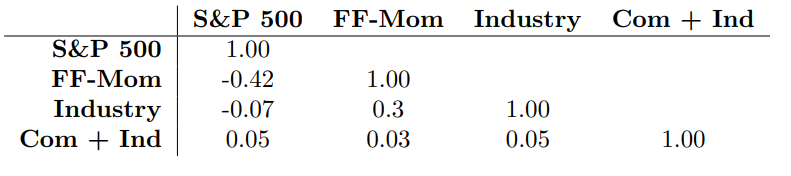
9. Fama-French Comparison
The models are able to account for return drivers beyond the market or momentum factor, which is evident from the low correlation of returns with the S&P 500. This suggests that adding these portfolios to an existing strategy could provide diversification benefits, although further analysis is needed.
Conclusion:
The researchers combined past research to incrementally improve their data and modeling approach, resulting in a unique combination that outperformed simple statistical approaches and provided diversification benefits. They found that returns-based indicators and adding other asset classes improved portfolio performance, and that improving their forecasting approach was the key to their success.
While they recognize the limitations of their study, they suggest future work could explore which predictors added the most value, as well as more complex models that can work across assets and employ neural networks to model non-linear relationships.