Researchers:
Spencer Tirella
Abstract:
Economic recessions are considered to be a necessary part of the business cycle. In the United States, an economic recession is declared by the National Bureau of Economic Research (NBER) after two consecutive quarters of negative gross domestic product growth. Through four machine learning algorithms over economic indices and select economic data, this paper aims to predict if the U.S. economy is in recession ahead of its official determination by NBER. The machine learning predictions indicate a strong degree of accuracy in determining when the economy is not a recession, but have limited accuracy in predicting a recession. Across the four models, two have determined that the economy may currently be in a recession (as of October 2022) ahead of any official declaration.
Methodology:
Data Model
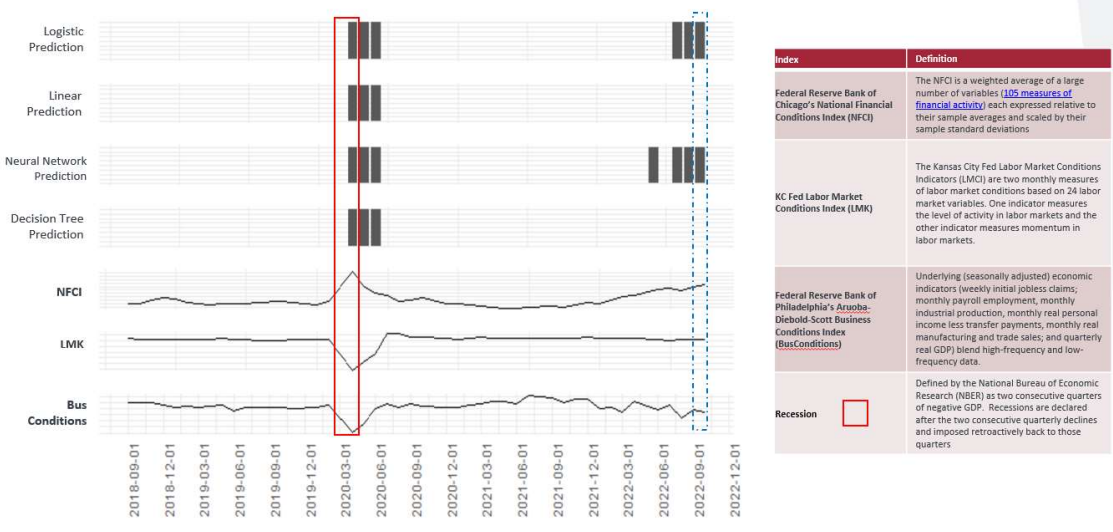
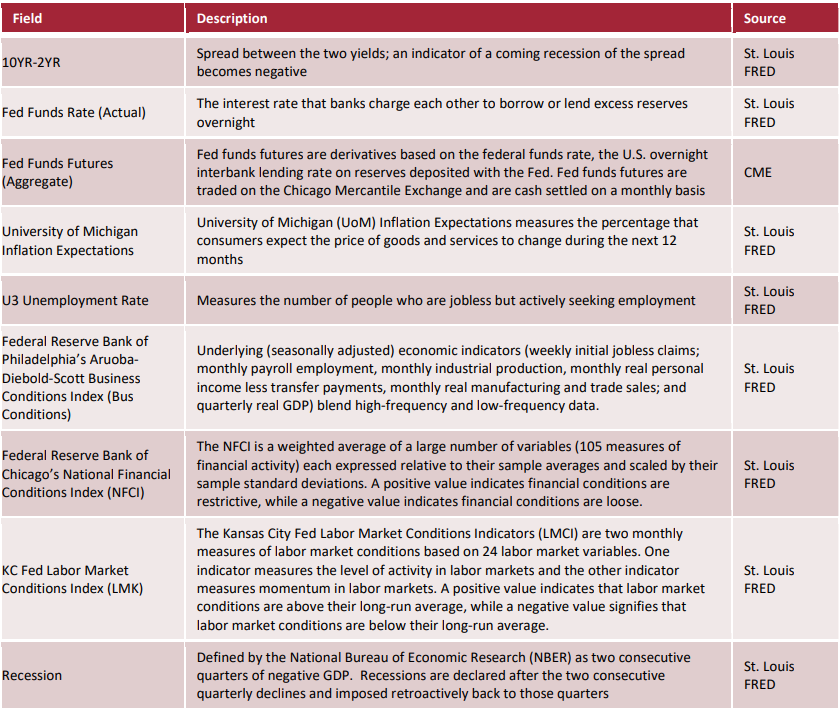
In defining the dataset for the machine learning models, five major economic data elements are observed along with three economic indices. Using these elements, as dependent variables, the model aims to predict ‘Recession,’ which we define as the independent variable. All data are observed monthly from the period August 1, 2001 through October 1, 2022.
Machine Learning Algorithms
Using this dataset, four different machine learning models were created and run through four separate techniques to assist in optimal model selection. The models and techniques can be seen in the figure below.
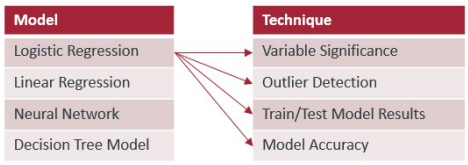
Using the above-mentioned data and algorithms, the aim is to determine the most accurate algorithm and observe its prediction for the present period. The full dataset contains 219 observations, and is divided into a training set of 176 observations and a test set of 43 observations, representing an 80% / 20% split between training and test data.
Results:
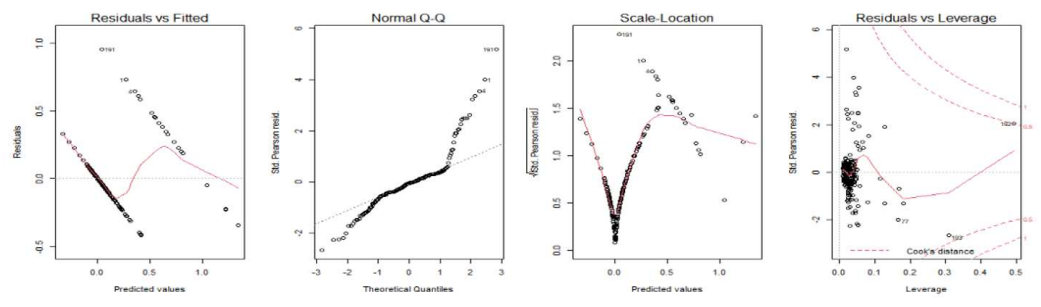
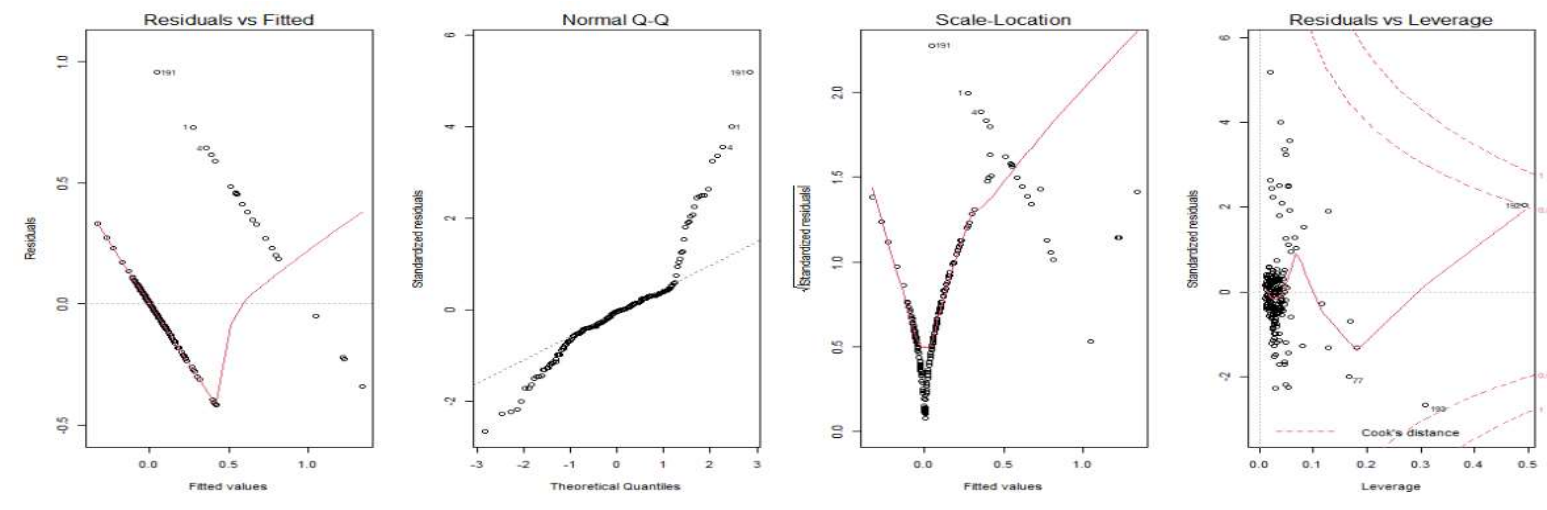
Logistic Model – Outlier Detection
To consider and validate an overfitting of our model, we check for outlier data points. Data points 191 and 192 in the below plots represent March and April 2020, which correspond to a recession triggered by the onset of the covid pandemic. These particular data points correspond to significant (multiple standard deviation) swings in the other variables. However, given the limited number of recessionary periods in our dataset and the remote possibility of these unique events occurring, we choose to leave them in the model.
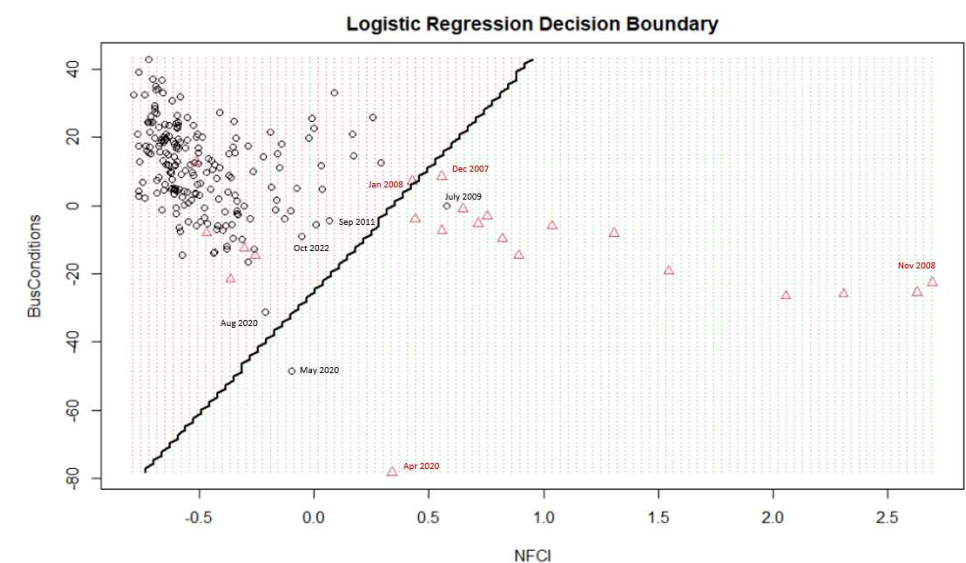
Logistic Model – Test Model Results
The model correctly identified the recession in April 2020 but misclassified the periods before and after. It incorrectly indicates the economy is currently in a recession as of August 2022, which is not supported by GDP data. To determine the accuracy of the logistic model, a confusion matrix is established over the test data. Although there is a high accuracy overall at 86%, there is bias in the result as the distribution is skewed toward 0 (not a recession). Given this disproportion, the balanced accuracy, taking into account sensitivity and specificity, provides a more accurate depiction of the model’s ability to predict a recession at 69%.
Linear Model – Outlier Detection
Similar to the logistic outliers, the linear model shows data points 191 and 192 in the below plots, representing March and April 2020, which correspond to a recession triggered by the onset of the covid pandemic. Similar to the logistic conclusion, we choose to leave them in the model given the limited number of recessionary periods in our dataset and the remote possibility of these unique events occurring.
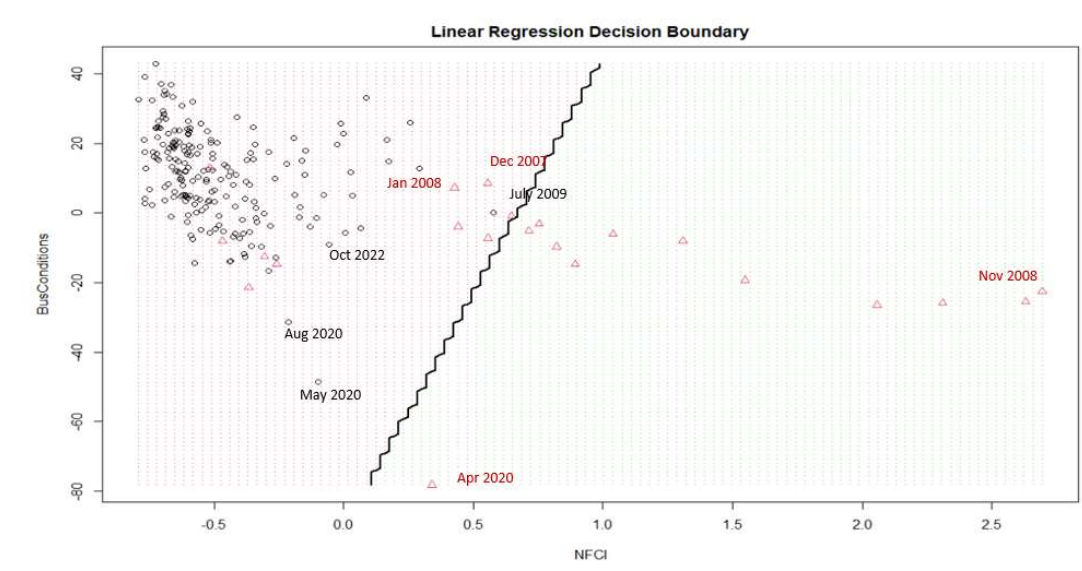
Linear Model – Test Model Results
Similar to the logistic model, the linear model flagged a recession period in April 2020, and also misclassified in the following two periods. Contrary to the logistic model, the linear model indicates no recession in the present period. A linear regression decision boundary is also displayed below. It has less accuracy than the logistic model in classifying recessions, but was entirely accurate in classifying non-recessionary periods.
Neural Network Model – Outlier Detection
To detect outlier variables influencing the model, neural network decision boundaries mapped across the NFCI and Bus Conditions index were observed. In the visualization, it is clear that April 2020 period in red generating a significant decision boundary when the BusConditions index is sharply negative.
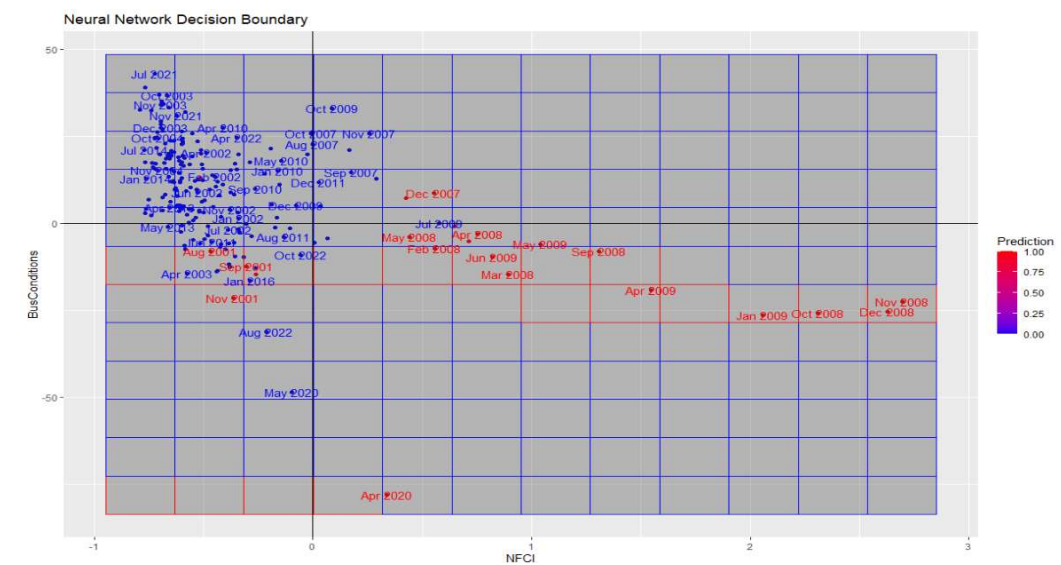
Neural Network – Test Model Results
The neural network with 3 hidden layers misclassified the next two periods after detecting the April 2020 recession, and continuously classified a recession from June 2022 to present, resulting in less accuracy than logistic and linear models. The model is overfitting due to its hidden layers and random seed, resulting in inaccurate predictions of recessionary periods.
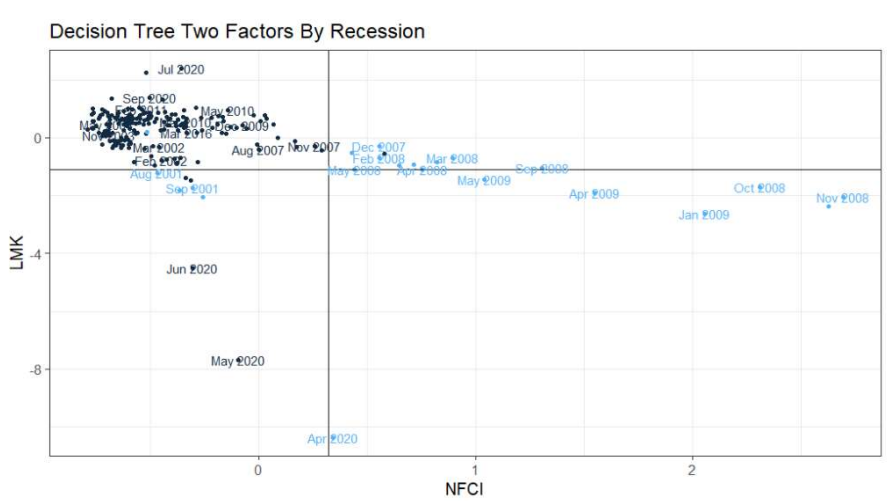
Decision Tree Model – Outlier Detection
The recessionary periods are plotted against these variables along with the decision boundary lines. The decision tree is very accurate in classifying recessionary periods based on the two variables (LMK, NFCI) alone. April, May, and June of 2020 continue to be outliers.
Decision Tree Model – Test Model Results
The test model results from the decision tree once again capture the April 2020 period, but also misclassify the following two months. In addition, the decision tree predicts no recession in the present period, as the LMK for the current period is 0.30305, well above the boundary of negative -1.1. Decision tree generates the highest accuracy overall and balance accuracy of all models and matches the linear model. This is due to the model having a better fit on the training data as compared to logistic and neural network.
Conclusion:
In attempting to forecast US economic recessions with machine learning models, a few key observations resulted. Of the initially selected variables, the 10Y-2Y, NFCI, Unemployment Rate, Business Conditions, Labor Market Conditions, and Fed Funds Futures are the most statistically significant. Within the time horizon of the data model, April 2020 proved to be a major outlier across all models, influencing their results. With respect to accuracy, the linear model and decision tree were the most accurate and also reflected a lesser model overfit as compared to the logistic model and neural network. Although the logistic model and neural network predict a recession in the present period, this result will not be conclusively accurate or inaccurate until April of 2023 such that negative GDP resulted in Q4 2022 and Q1 2023.