Researchers
Ian Kupelian, M.S. in Financial Engineering, Graduated in May 2020
Advisor:
Dr. Cristian Homescu, Director Portfolio Analytics, Chief Investment Office at Bank of America Merrill Lynch
Acknowledgements: This project is in collaboration with Quantitative Wealth and Investment Management (QWIN), Bank of America
Introduction
Any investor who has spent considerable time in the market will acknowledge the importance of the ”market cycle” in asset allocation decisions. These market cycles, or regimes, reflect stark changes in the risk and return profile for asset classes. If an investor can determine when these regime changes occur, and adjust his or her portfolio accordingly, there is considerable potential to improve the performance of the portfolio.
As determining these regimes can be so beneficial for investment performance, many statistical and econometric tools have been developed to aid in regime detection. When considering these regime detection methods we are interested in a few different criteria. First, does the method identify common regimes across multiple asset classes, and thus identify the overall macroeconomic backdrop? Secondly, is the regime estimation stable, or does the estimated regime change frequently? Finally does the portfolio outperform a traditional asset allocation from a risk or return standpoint?
In terms of portfolio construction, we consider two methodologies. The first is the mean- variance optimization as laid out by Markowitz. A regime-dependent set of returns and covariance matrices are constructed from the historical regimes, and the current regime is used to preform the portfolio optimization. This will be contrasted to the performance of a simple mean-variance optimization using only the historical mean return and covariance estimation.
Methodology
To detect regimes, two methods are considered. The first is a Markov Switching Model (MSM) as developed in Kim et al. (2008). This method allows detection of endogenous regime switches in asset returns. This model allows for the detection of two or more endogenous regimes.
The Markov Switching Model will be compared with the Hidden Markov Model (HMM) as described in Nystrup et al. (2016). This HMM Model also detects regime changes using the volatility of the asset returns, and allow for the detection of two or more regimes.
Portfolio construction is achieved using two methods. The first being Mean-Variance optimization as first developed by Markowitz. A regime-dependent set of returns and covariance matrices are constructed from the historical regimes, and the current regime is used to preform the portfolio optimization.
Model Predictive Control, as laid out in Nystrup et al. (2018) is also used to construct a regime dependent portfolio. This method takes into account the uncertainty around the estimation of the state, which should hopefully lead to a more conservative portfolio allocation, and further improve the risk performance of the regime-dependent portfolio.
Results
As the main focus of this project relates to asset allocation, we will consider the monthly returns of the seven indices in table 1, which give a good representation of public market asset classes that are typically held by an institutional investor.
| Index | Asset Class |
|---|---|
| S&P 500 | Equities |
| Bloomberg Commodities Index (BCOM) | Commodities |
| HFRI Hedge Fund Index | Hedge Funds |
| Bloomberg Barclays US Aggregate Total Return Index | Fixed Income |
| Bloomberg Barclays Municipal Bond Total Return Index | Fixed Income (Tax-Exempt) |
| Bloomberg Barclays US Corporate High Yield Total Return Index | Fixed Income (Credit) |
| Bloomberg Barclays US Treasury Total Return Index | Fixed Income (Risk-Free) |
Table 1: Asset Classes for Regime Detection and Portfolio Construction
We can consider two and three regime models for the regime detection methods. We find that in both cases the three regime method does a better job of clearly representing historical periods of high stress. As such we will consider a three regime model for both the MSM and HMM models.
The goal is to produce similar regimes across all the different asset classes. Figure 1 shows all seven assets over with regimes identified.
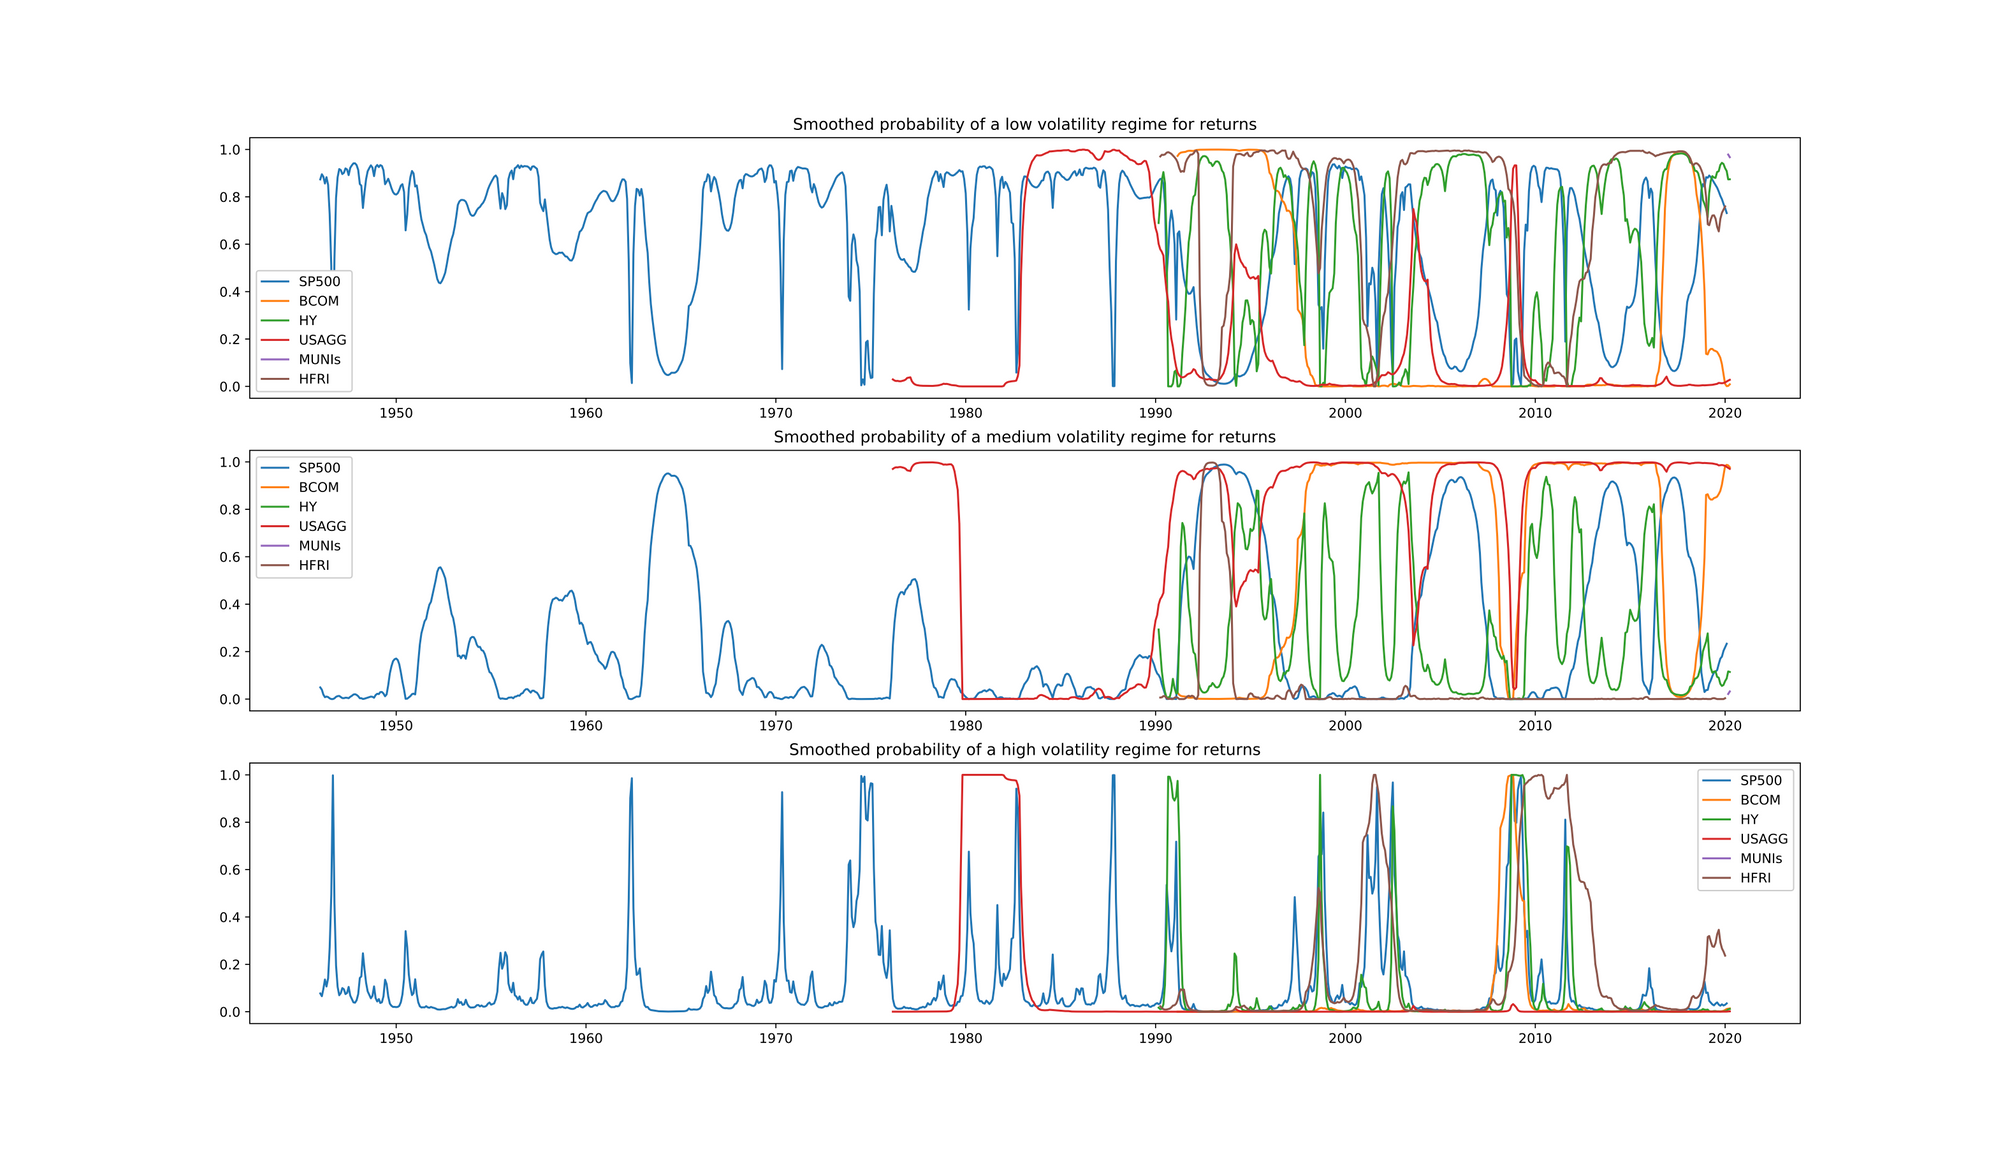
The three regime MSM identifies broadly similar regimes across all of the asset classes. This is a good indicator that the broad economic backdrop is being captured by the Markov switching model. It is important to note that some of the differences in regime are due to construction of the indices or the liquidity differences in the underlying instruments.
When considering the asset returns for each period, we see that risky assets under preform in periods of high volatility. Table 2 shows the asset returns for each period.
| Period | S&P 500 | T-Bonds | USAGG | HY | MUNI | BCOM | HFRI |
|---|---|---|---|---|---|---|---|
| Full Period | 0.652% | 0.640% | 0.601% | 0.784% | 0.553% | 0.018% | 0.764% |
| Low Vol | 0.872% | 0.695% | 0.667% | 1.056% | 0.621% | 0.440% | 0.729% |
| Medium Vol | 0.947% | 0.444% | 0.403% | 0.846% | 0.415% | 0.062% | 1.047% |
| High Vol | -2.914% | 1.267% | 0.769% | -1.294% | 0.550% | -2.985% | -0.561% |
Table 2: Monthly Mean Return for Different MSM Regimes
We can then use these returns to construct a regime dependent portfolio, and compare the portfolios to a 60/40 Equity/Bond portfolio and a standard mean-variance portfolio. Figure 2 shows a comparison of the cumulative return for a 60/40 portfolio, the full period mean-variance portfolio, and the three regime-dependent portfolios.
We see that while the 60/40 portfolio suffers a steep draw down in the global financial crisis, the mean-variance portfolios avoid this through a great deal of diversification. While they have losses, they are much more gradual, and more quickly recovered. However, the method of regime labeling clearly makes a difference in the return profile of the portfolio. We see that the MSM model has the greatest cumulative return over the period of any of the portfolios.
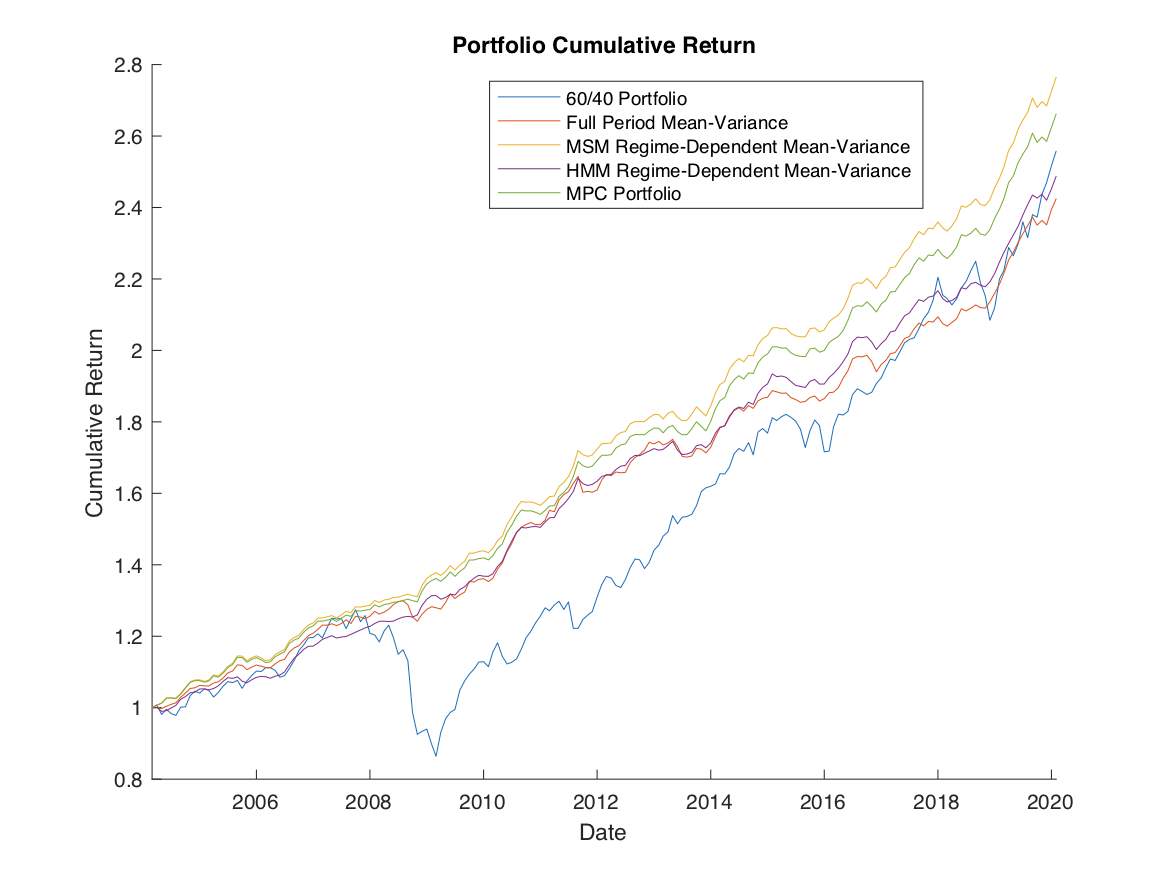
The HMM portfolio leaves much to be desired when compared to the MSM portfolio when returns are considered. However, we still must consider the risk metrics before we can come to a final conclusion on the performance of the different methods. Table 3 shows the risk profile of the portfolios. The cumulative return of the MPC portfolio is lower, but this Cumulative Return is partly because a large risk aversion parameter is used. The Sharpe ratio and risk metrics are improved compared to the MSM mean-variance portfolio, though only slightly.
Overall the regime dependent portfolios improve the risk performance compared to the traditional portfolio constructions. The improvement in the risk metrics shows that both the MSM portfolio construction techniques are worth pursuing over a traditional approach.
| Portfolio | Sharpe | Monthly VaR | Max Draw Down | Volatility |
|---|---|---|---|---|
| 60/40 | 0.2397 | 37.22% | 32.20% | 7.47% |
| Full Period MV | 0.6392 | 0.82% | 3.8% | 2.68% |
| HMM Regime | 0.6806 | 0.70% | 2.14% | 2.59% |
| MSM Regime | 0.7074 | 0.68% | 1.45% | 2.37% |
| MPC MSM | 0.7102 | 0.61% | 1.36% | 2.31% |
Table 3: Portfolio Risk Metrics
Conclusion
Regimes naturally arise in any conversation about asset allocation. As an investor shifts his or her allocation it is vital that the market regime be considered. We have explored different ways to identify market regimes based upon asset returns, and different ways to construct a portfolio.
We have considered both the Markov Switching Model and the Hidden Markov Model for determining the market regime. That the MSM method out preforms the HMM method points to the importance of the method used to determine regime. In the worst case scenario, misidentifying a regime could lead to a portfolio that is inferior to even the traditional methods.
We also see the value from considering the full distribution in the portfolio construction process. While this adds additional complexity, it greatly improves the risk performance of the portfolio.
The promise of this regime based investing is evident in both risk and return characteristics of the portfolio. These methods are easy to implement and provide intuitive results that match our experiences in the market. Every investor should ensure that his or her portfolio is constructed with some regime framework in mind.
References
Kim, C.-J., J. Piger, and R. Startz (2008). Estimation of markov regime-switching regression models with endogenous switching. Journal of Econometrics 143 (2), 263–273.