Researchers
Eric Mozeika, M.S. in Financial Engineering, Graduated May 2020
Andrew Shield, M.S. in Financial Engineering, Graduated May 2020
Dheemanth Sriram, M.S. in Financial Engineering, Graduated May 2020
Advisor:
Dr. Cristian Homescu, Director Portfolio Analytics, Chief Investment Office at Bank of America Merrill Lynch
Acknowledgements: This project is in collaboration with Quantitative Wealth and Investment Management (QWIN), Bank of America
Abstract
The use of Machine Learning (ML) in financial markets has become a popular topic in recent years. We apply these concepts to empirical asset pricing in an attempt to further understand their potential improvements over classical asset pricing models. In addition, we run several types of ML models and perform comparative analysis of their benefits against each other and across different sets of market data such as returns from industries, stocks and commodities. We then deploy a backtesting framework and implement an equally-weighted long-short portfolio in order to study each model's ability to forecast returns. Finally, we investigate methods to improve the accuracy of these models with the goal of boosting portfolio performance. Our analysis consists of two parts: (1) determining the model's ability to make accurate forecasts and (2) ascertaining its ability to create superior portfolio returns in comparison to classical models.
Keywords: Machine Learning, Empirical Asset Pricing, Financial Forecasting, Random Forest, Stacking Ensemble, Regularized Regression, Decision Trees, Portfolio Analytics, Data Science
Data and Methodology
For asset prices we chose several different datasets to examine the robustness of our strategies and their relative strengths and weaknesses. We used 30 value-weighted industry portfolios from the Kenneth French Data Library. We utilize CRSP databases for individual stock returns spanning the period from 1980 to 2019, and also use commodity returns data. In addition to these prices we construct predictor variables based on momentum and overall market state. We also add lagged returns from other assets in an attempt to capture an industry rotation effect in the overall market.
We implement a backtesting framework using a walk-forward approach, giving our ML model all past data to train on. We then make predictions for the next step forward across all assets in our selection universe. Using these predictions we create an equally-weighted long- short portfolio. We calculate forecasting errors and portfolio statistics to adequately evaluate the improvements of our portfolio over classical asset pricing approaches.
We test numerous ML models including linear regression, LASSO, Elastic Net, Decision Trees, Random Forests, Neural Networks and a Stacking Ensemble. Many of these models were tested with different hyperparameters to examine their sensitivity as well. We benchmark our forecasting errors by relative scores versus classic statistical forecasting benchmarks such as Naive, Drift, Prevailing Mean and Auto Arima models. For portfolio evaluation we compare our portfolios to traditional financial benchmarks like the S&P 500 index and French-Fama momentum portfolio.
Main Results
Our main results are expressed into two parts: the forecasting performance and the portfolio performance. In order to run comparative analysis we adjust our errors relative to the Naive benchmark (lagging returns by one step). Our ML models were able to reduce forecasting errors significantly with the models performing best being the Neural Network and our Stacking Ensemble.
| Stocks | Industries | ||||
|---|---|---|---|---|---|
| Model | MSE | Adjusted Error | Model | MSE | Adjusted Error |
| Naive | 76.96 | 1 | Naive | 62.01 | 1 |
| Auto Arima | 37.22 | 0.48 | Auto Arima | 30.07 | 0.48 |
| Enet (3, 0.9) | 37.58 | 0.49 | Enet (1, 0.5) | 31.49 | 0.51 |
| Decision Tree | 70.47 | 1.14 | Decision Tree | 39.75 | 0.52 |
| Neural Network | 29.16 | 0.38 | Ensemble | 13.59 | 0.22 |
| Ensemble | 16.53 | 0.21 | |||
Table 1: Naive Adjusted Errors
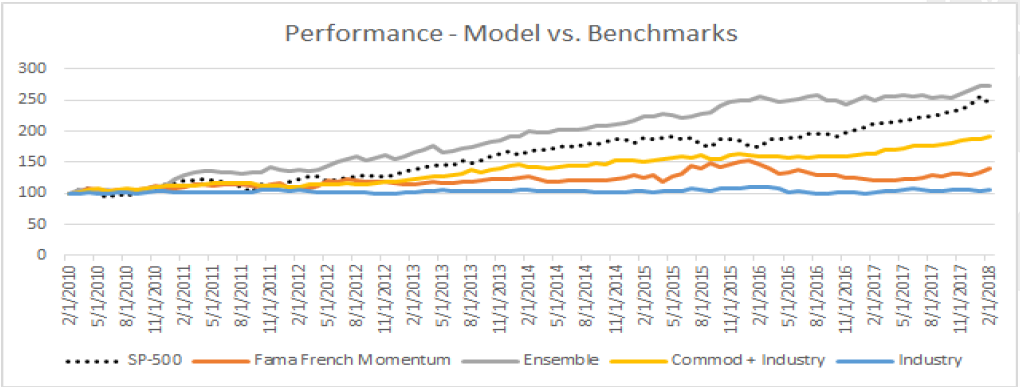
We examine our ML models further by testing a variety of applications. The ones which provide the most promising results are the stacking ensemble and creating a commodity- industry portfolio. The results support our intuition. In general, a stacking ensemble provides a more robust prediction since it is a combination of several sole ML models and the commodity- industry portfolio is built on the premise that a diverse portfolio creates an ability to maximize the return-volatility tradeoff in portfolio theory.
| Mean Return | Annual Volatility | Sharpe | |
|---|---|---|---|
| S&P 500 | 12.0% | 11.8% | 1.08 |
| Stocks | 0.8% | 3.9% | 0.22 |
| Industry | -0.2% | 4.5% | -0.01 |
| Ensemble 1(Stocks) | 6.9% | 6.4% | 1.11 |
| Ensemble 2 (Stocks) | 5.9% | 7.7% | 0.80 |
| Ensemble 3 (Stocks) | 4.7% | 6.8% | 0.74 |
| Ensemble 1 (Ind) | 9.1% | 7.9% | 1.19 |
| Ensemble 2 (Ind) | 7.2% | 7.4% | 1.01 |
| Ensemble 3 (Ind) | 7.4% | 8.1% | 0.96 |
Table 2: Portfolios 2010-2017 with all predictor variables
Conclusion
Through the hundreds of ML models tested during the process of our work we have drawn several conclusions. One is that ML provides significant gains in empirical asset pricing as it can provide superior performance in both forecasting measures and portfolio construction. When adding information about the overall market state we achieved more robust portfolios as well. This indicates that there is room for improvement, especially if one can forecast the future market state. We are confident that future work can definitely be to explore new and non- traditional assets for pricing such as cryptocurrencies.