Researcher
Xiaolu Li, M.S. in Financial Analytics, Graduated December 2019
Advisor:
Dr. Dragos Bozdog
Abstract
Views on equilibrium exchange rate have been different among macroeconomic researchers and policymakers. In this project, its relationship with medium-run exchange rate is studied. To estimated equilibrium exchange rate, BEER model is used. It is one of the methods examining to what extent the equilibrium exchange rate is consistent with a country’s economic fundamentals. First, optimization method (Ordinary Least Square) is applied on BEER model for three pairs of currencies’ exchange rate (USD, BP, AUD) to get the optimal values of parameters for the model. Out of sample prediction is carried out with calibrated parameters. The calibration and prediction results show a significant association among the medium-run exchange rate and macroeconomic determents namely interest rate, inflation, trade balance, terms of trade, output gap, productivity levels for selected currencies.
Keywords: real exchange rate, equilibrium exchange rate, BEER
Main Results
For calibration, result for each pair currency will be discussed separately.
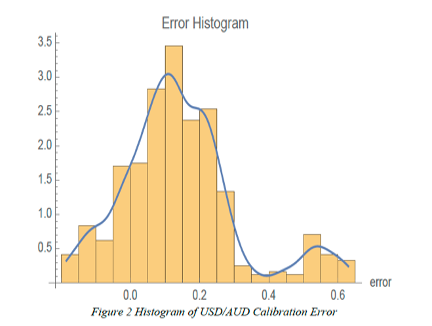
USD/AUD
Below graph is the calibration results for exchange rate between USD and AUD. In the first graph, the x axis is the time (from 1971 to 2010), the y axis is the exchange rate. The two lines represent real exchange rate and calibrated exchange rate. It shows that firstly the calibrated BEER rate is following closely with the real exchange rate. secondly, there is an overall undervalue for BEER calibrated rate.
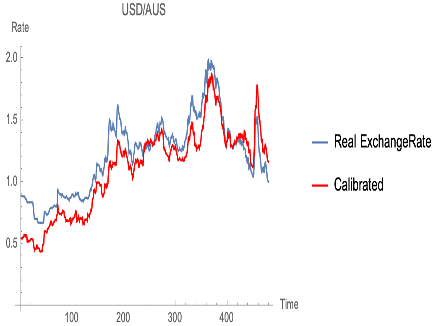
With optimized parameters plug back into BEER model equation for USD/AUD, we obtain:
$$ \begin{align} q_t = exp \left(0.0036 \left(421.65\left(2.4403\left(r_t^*+\Delta q_t ^e-r_t\right)+n \bar{f} a -\left(1 + k g_t ^*\right) \frac{n f a_{t-1}}{1+\gamma_t}\right) \\ -\frac{i_t ^ *}{1+\gamma_t}n f a_{t-1} - t r_t +0.0002 y_t - 5134.3 y_t ^ * -5689.7 tot_t\right)\right) \end{align} $$AUD/BP
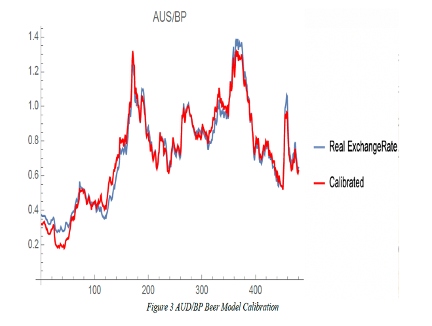
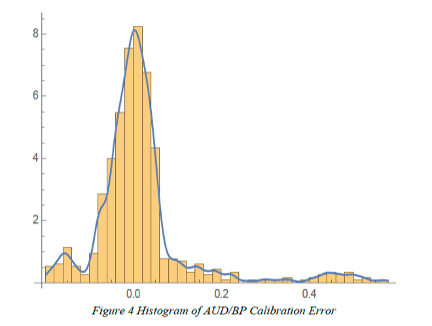
For AUD/BP, the calibration result graph shows that the calibration result is very close to the real exchange rate. This is also reflected in the histogram plot. Except an approximate normal distribution at the end. The distribution is symmetric around 0. These could be the reason that the factors affecting exchange rate between Australia and United Kingdom are captured at a very high level.
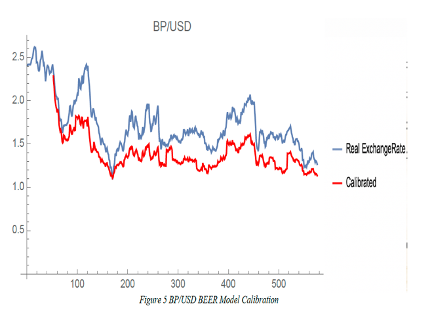
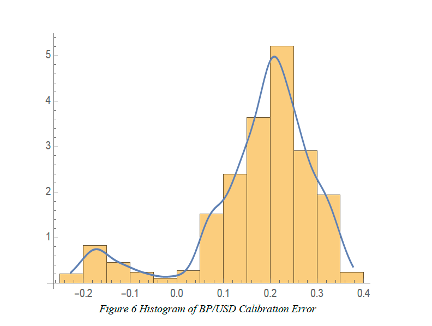
BP/USD
For BP/USD, the calibration result graph shows that BEER calibration is overall undervalued compare to the real exchange rate. Even this pair is the least performed among selected, the calibration results still follows the changes of the real exchange rate with ups and down. The error histogram confirmed the undervalue. The reason behind this could be one or two major economic fundamentals are not covered in the BEER model.