Researchers:
Christopher Ognibene
Faculty Advisor:
Dr. Khaldoun Khashanah
Abstract:
This research project presents a methodology for analyzing financial asset risk in the context of portfolio investing and liquidity planning and forecasting, using the industry-standard measures of Value at Risk and Conditional Value at Risk. Two computational techniques, empirical distribution and parametric approach, are employed to analyze historical equity market data from 2012 to early 2021. The results suggest that both measures of risk are equally valid, but the authors prefer CVaR based on their visual and numerical analysis. The parametric method may be advantageous for complex financial data. The paper concludes with suggestions for future research in this area.
Results:
1. Rolling risk calculations:
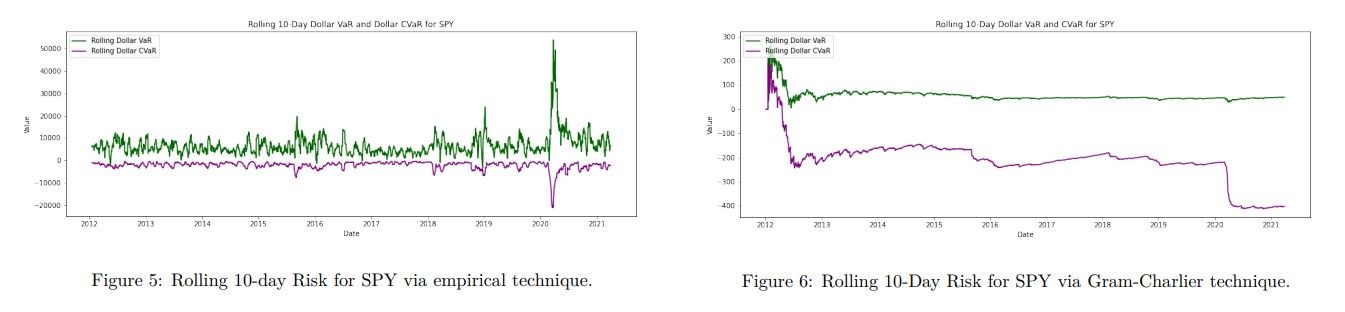
The below image show the rolling 10-day risk, VaR and CVaR, for our SPY benchmark, computed via both empirically and parametrically
In the figure below, we can see the rolling 10-day VaR for our Select Sector ETFs, computed via empirical and parametric methods
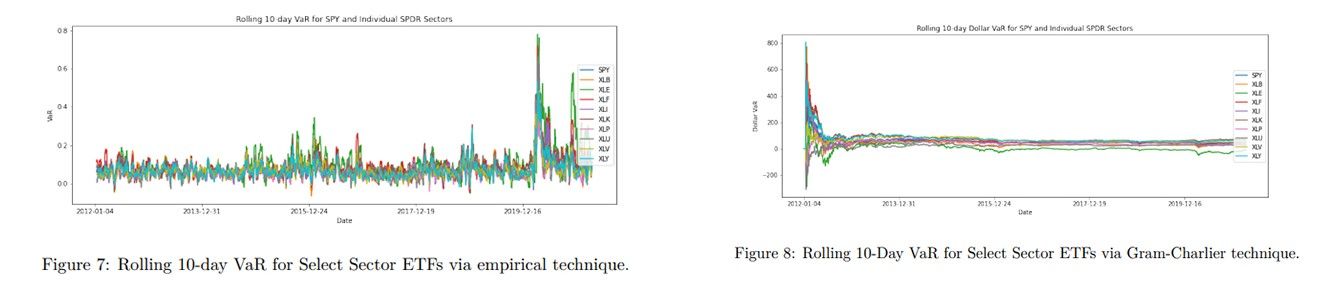
The parametrically-computed plots show a period of high volatility that decreases and stabilizes towards the right of the plot. The reason for this observation is not clear yet, but it could be due to the choice of sample data and timeframe or related to the convergence of the Gram-Charlier series expansion algorithm.
2. Rolling risk forecasting:
In this section, we present our VaR and CVaR forecasts for our estimates from the empirical distribution technique. The two figures below show forecast plots for VaR and CVaR for our benchmark SPY:

Below two figures, we can see forecast plots for VaR and CVaR for our hypothetical portfolio of financial assets:
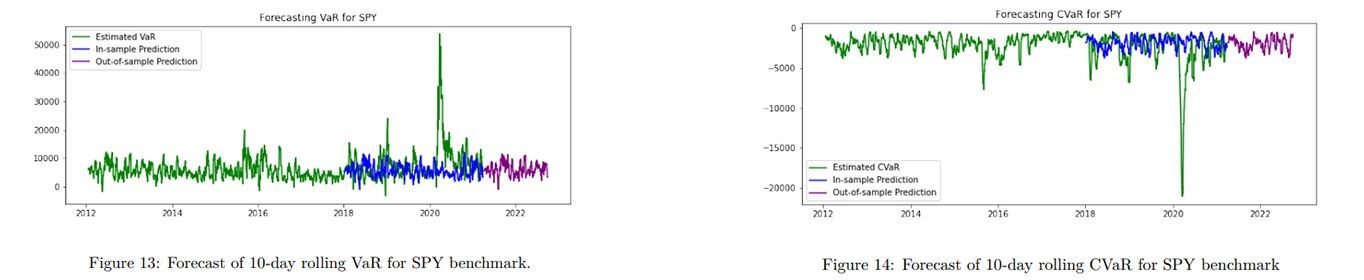
We assess our model forecasting performance by computing the meansquared error of our predictions. For the VaR forecasts, overall portfolio mean-squared error is similarly very high: 586,685,056.80. For the CVaR forecasts, overall portfolio mean-squared error is similarly very high: 971,732,328.84
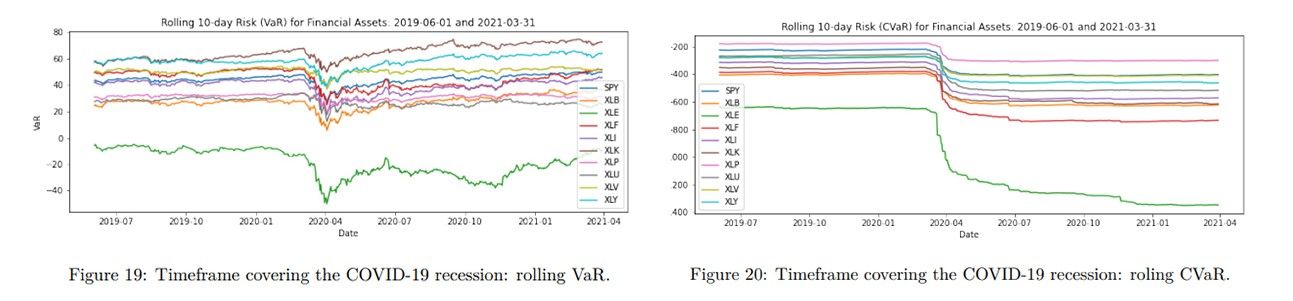
3. Covid timeframe Analysis and Discussion:
Our focus is on the time period starting from June 1, 2019 until March 31, 2021, which includes the beginning of the economic recession caused by the COVID-19 pandemic in March 2020.
The below two figures show zoomed-in plots for our financial assets, computed via empirical technique.
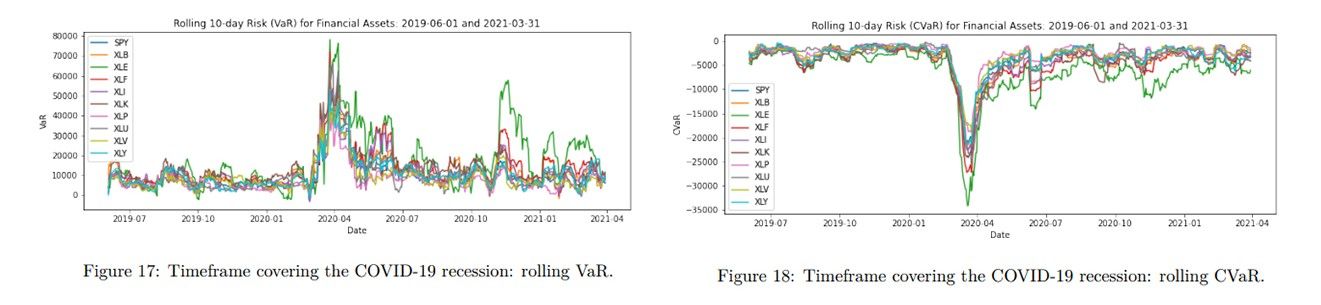
We can infer that the energy sector, XLE, has the highest risk, as seen in both plots. The COVID-19 pandemic caused a sudden demand drop for energy, making it unsurprising that the XLE curve peaked in April 2020 during market volatility. The plots' risk estimates align with the reality of the pandemic recession, providing confidence in the risk analyzer tool. Sectors such as Utilities and Consumer Staples traditionally considered safe during economic downturns have lower or flatter curves, indicating potentially lower financial risk.
We zoom in to the timeframe of focus on the equivalently-computed plots for our financial 20 assets via the parametric distribution method, and observe similar results as we got from empirical technique
Continuing to focus on the COVID-19 timeframe, we look at how our hypothetical portfolio may have performed during this timeframe. The two figures below provide the result via empirical and parametric technique, respectively.
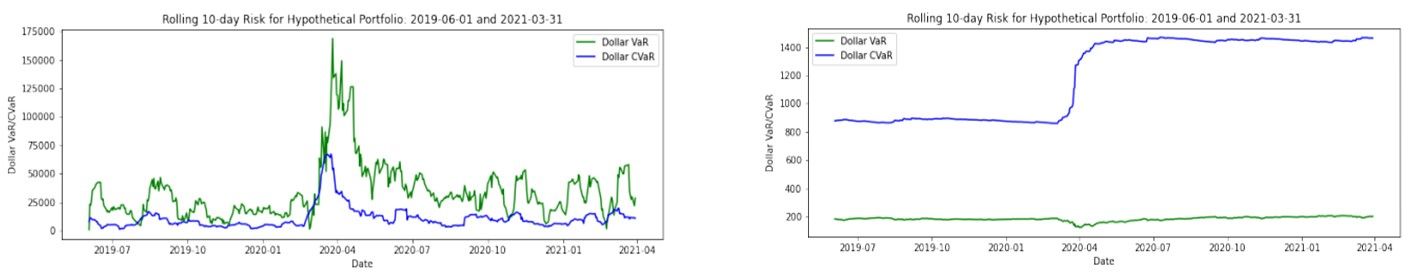
The observations we made earlier are supported by our plots, which show a peak in risk around April 2020 followed by a decline. This is not surprising because around that time, the government started discussing economic stimulus policies to boost market activity. As the year progressed, the market showed signs of improvement, and our plots suggest that economic sentiment improved in the latter half of 2020 and early 2021.
Conclusion
In conclusion, our research suggests that using CVaR as a risk measure is recommended, as it is currently favored in the industry. CVaR provides a "worst-case" scenario by estimating a loss threshold and anticipating the possibility of further loss beyond that threshold. This makes CVaR a better risk estimator for planning purposes.