Researchers:
Yijing Yuan
Yuki Homma
Faculty Advisor:
Zhenyu Cui
Abstract:
In recent years, machine learning techniques were vastly advanced and widely adapted in many financial service practices. However, predicting financial time series with medium to long term horizons remains a territory to be further explored, even though it provides great benefits to fields like quantitative wealth management where trades are settled less frequently. This paper compares the medium term prediction accuracy of four state-of-art time series models which are Feature-based Forecast Model Averaging (FFORMA), Optimized Ensemble, DeepAR and DeepFactor, and evaluates their performance in application to mean variance portfolio optimization. The value of time series models in quantitative wealth management is demonstrated by showing a winning method that consistently outperforms the historical benchmark portfolio. Though further testing is required before real world implementation, this paper presents a promising model and sheds light on the possible future directions of research on the application of time series models in portfolio management.
Experiment:
Data:
A set of indices that are widely available and have daily granularity and have decades long price history starting from 1990 are selected for the experiment. Illiquid assets were ruled out based on the daily returns and trading volumes. Each selected index is a representative of a distinct market sector, industry or asset class. This way, the indices are most likely to be unrelated with each other in a nonlinear fashion. The data includes daily prices of 14 indices covering the period from 01/01/1990 to 12/31/2019, all downloaded from Bloomberg.
Setup:
The experiment consists of two major steps. The first step is to train all time series prediction models and evaluate the model performance in terms of accuracy. ARIMA is used as the benchmark model as it is a classical model for financial time series. The set of parameters that produces the least mean absolute percentage error (MAPE) is used for time series prediction. The second step is portfolio construction and performance evaluation. The benchmark portfolio only used the historical data. On the other hand, the enhanced portfolios only used the predicted daily returns that are obtained from the time series forecasting models. The second step is portfolio construction and performance evaluation. The benchmark portfolio only used the historical data. On the other hand, the enhanced portfolios only used the predicted daily returns that are obtained from the time series forecasting models.
Results:
Time Series Forecasting:
In terms of Mean Absolute Scaled Error (MASE), deep learning models (DeepAR, Deep Factor) drastically outperform the benchmark model. Mean Absolute Percentage Error (MAPE) punishes the instances where forecasts are higher than actuals. Low MAPE suggests that the model is less likely to overestimate the positive returns and underestimate the losses. This means that the Optimized Ensemble is performing the best in terms of not exaggerating returns.
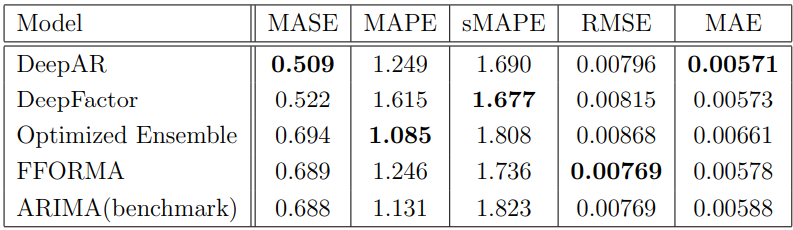
All models outperform the benchmark for symmetric Mean Absolute Percentage Error (sMAPE) as all models are engineered to minimize sMAPE. In terms of Root Mean Square Error (RMSE), no model outperforms the benchmark model. For Mean Absolute Error (MAE), DeepAR performs best, followed by Deep Factor.
Portfolio Optimization:
Different variations of the mean variance optimization portfolios were experimented by changing the weight constraints and risk aversion inputs λ. Firstly, λ was set to 1.0 and a long only portfolio was constructed to evaluate the profitability of all portfolios. The optimized ensemble outperformed the historical benchmark portfolio as well as the other three models that were less profitable than the benchmark portfolio.
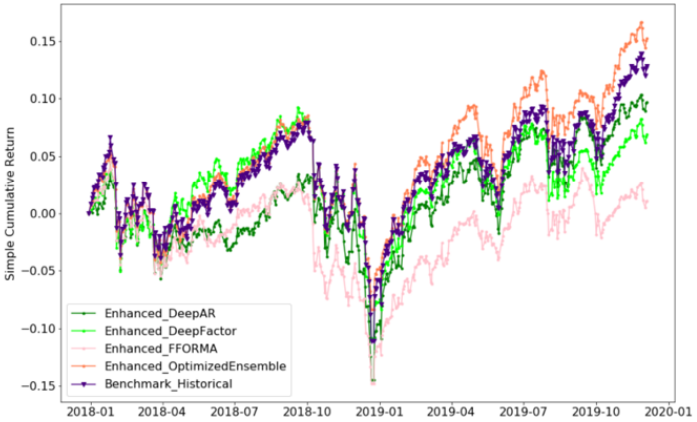
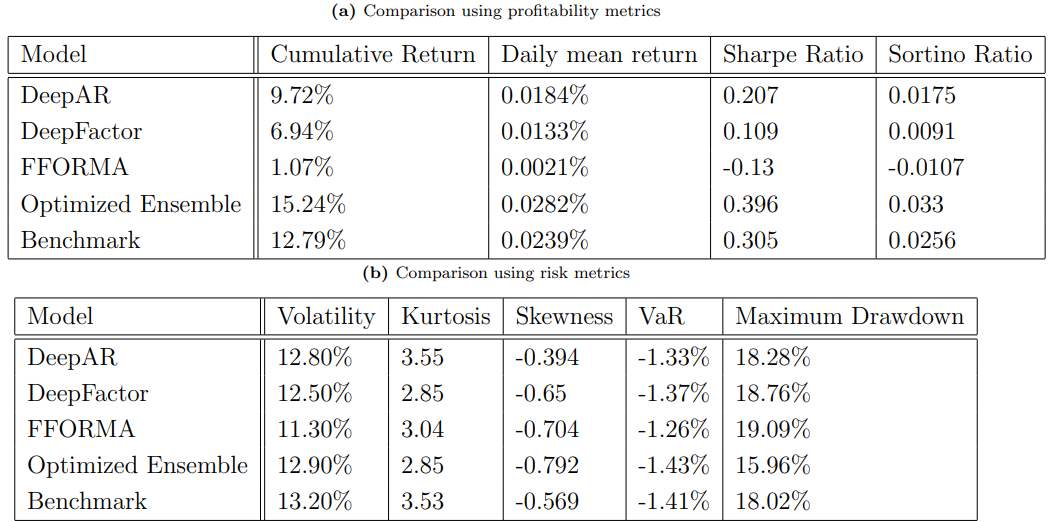
Table below further compares the performance of the portfolios, displaying the results of profitability metrics and risk metrics. Optimized ensemble dominates all metrics across the board by producing the highest cumulative returns and risk adjusted returns, and lowest Value at Risk and Maximum Drawdown.
Keeping the risk aversion input λ fixed to 1 and adjusting constraints to allow short selling, a long short portfolio was constructed. The optimized ensemble outcompeted the historical benchmarking portfolio and the other enhanced portfolios in this case.
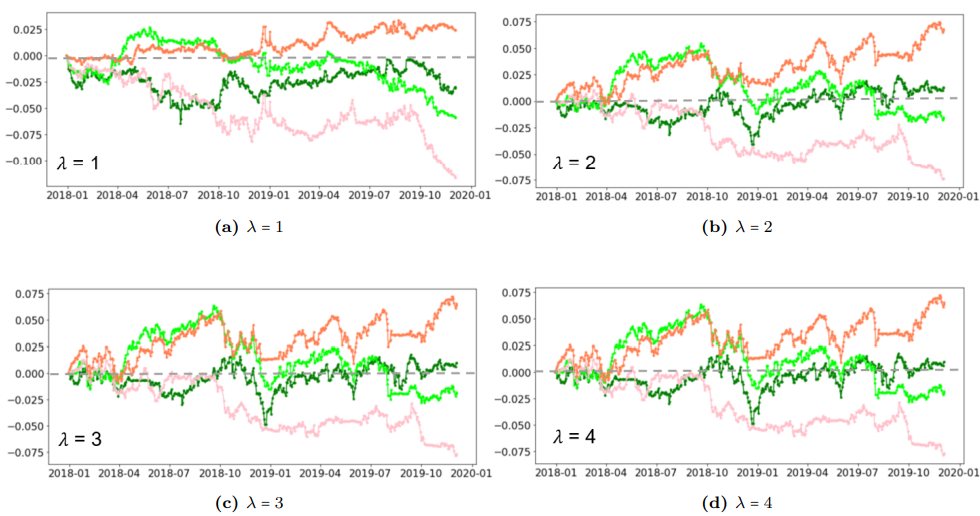
In the next step, the portfolio was restricted to be a long only portfolio, while the risk aversion inputs varied having the values 1, 2, 3, and 4. The optimized ensemble portfolio outperformed the benchmark portfolio in all risk aversion levels experimented.
The same experiment with different risk aversion levels was carried out in the long short portfolio. Similar results of the portfolio performance was obtained.
Conclusion:
The study finds that deep learning models generally perform better in terms of error metrics, but suffer in terms of MAPE which heavily penalizes negative errors. In contrast, the optimized ensemble model outperforms all other models in terms of MAPE, which is preferred for assessing asset return predictions in constructing a mean variance portfolio. The optimized ensemble consistently outperforms historical benchmarks in all portfolio variations experimented, generating the highest returns in both long only and long short portfolios with four different risk aversion levels. However, the enhanced portfolios perform much better in portfolios with high risk aversion and become much more volatile when short selling is allowed. The study also finds that prediction accuracy evaluation offers limited value in determining if a time series model can improve mean variance portfolio optimization. Further research is needed to backtest the model performance in longer investing horizons and assess the model performance in periods of drastic market downturns.