Researches:
Abhimanyu Singh
Jeremiah Makaya
Sishir Yerra Doddi
Advisor:
Dr. Cristian Homescu
Abstract:
This paper explores the application of neural networks and data augmentation techniques to generate scenarios. The article compares the efficacy of the GAN Model, the Random Forest Model and the LSTM Model for the purpose of generating scenarios from financial time series data and empirically establish the method for scenario generation. The article concludes that LSTM model as the best model for generating scenarios. For data augmentation, Additive Gaussian to financial time series was applied. This article also explores the trading strategies based on the data augmentation which can outperform a simply buy and hold strategy of the S&P 500 ETF.
Results:
The research paper analyzed historical prices of the S&P 500 ETF from Yahoo Finance by computing its daily returns.
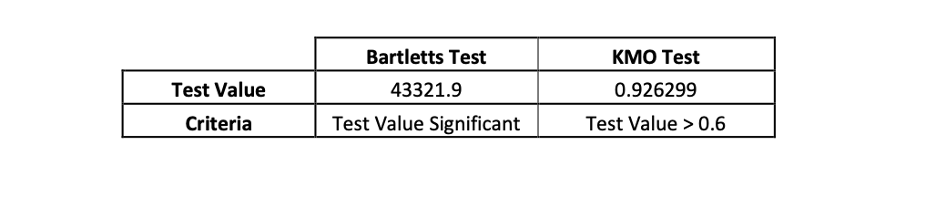
The result of the suitability of factor analysis on the historical data using the KMO and Bartlett's tests and the results of the Scree Plot of the eigenvalues of the above calculated returns as follows:
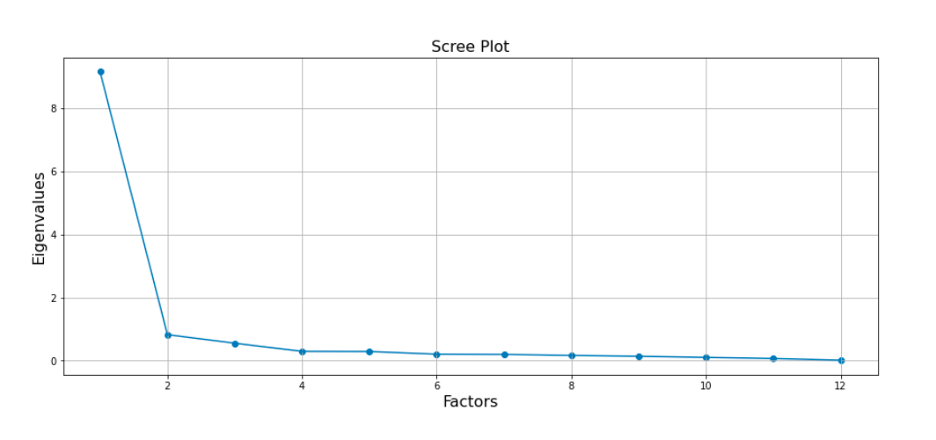
The scree plot elbows after two factors showing that two factors capture the common variance of the historical daily returns. the results of fitting a model with Varimax rotation are:
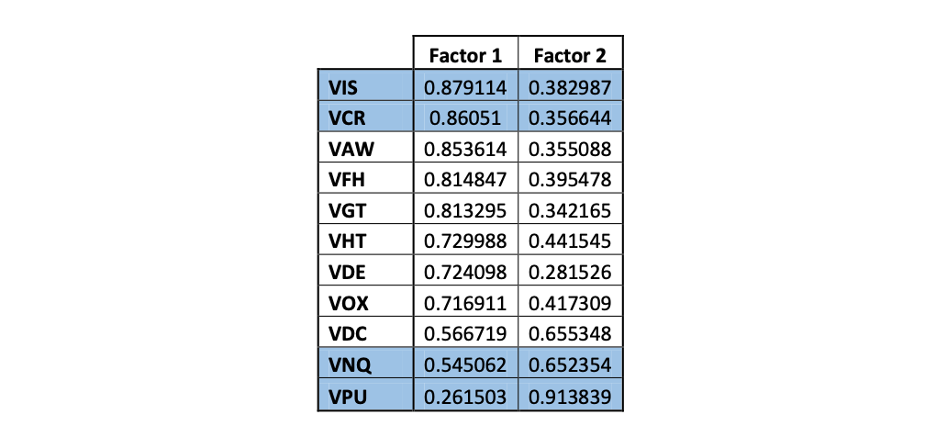
The factor trading strategy would be to invest in the highlighted sectors: VIS, VCR, VNQ, VPU.
The daily returns of the portfolio formed by the four tickers and the S&P 500 benchmark are as shown below:
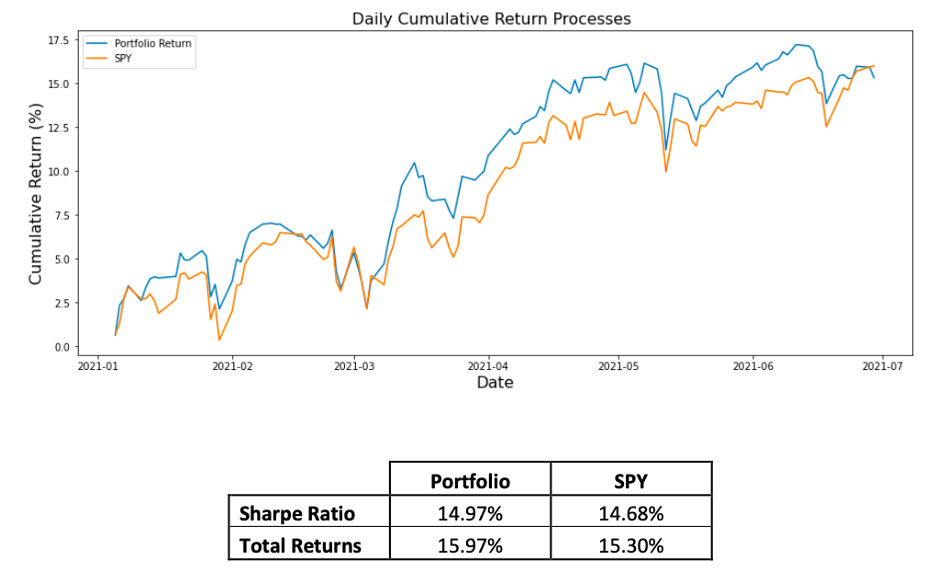
The factor trading strategy performed better than the S&P 500 index.
Part of the goal of this research paper was to empirically assert whether using augmented data improves this investment outcome. The procedure is same as with the implementation on the actual data. The only difference is the augmented historical return data is used in place of the actual returns data. The outcome of the factor investment strategy on this data is: VDE, VIS, VGT, VFH.
The daily returns of the portfolio formed by the above four tickers and the S&P 500 benchmark are as shown below:
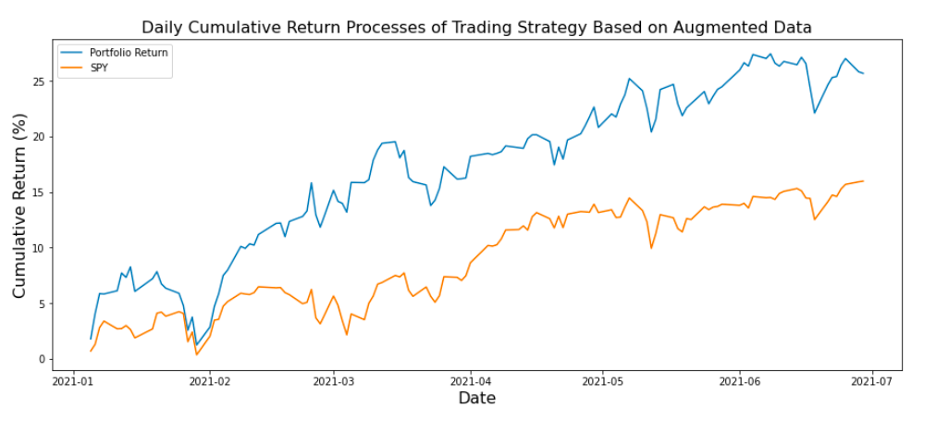
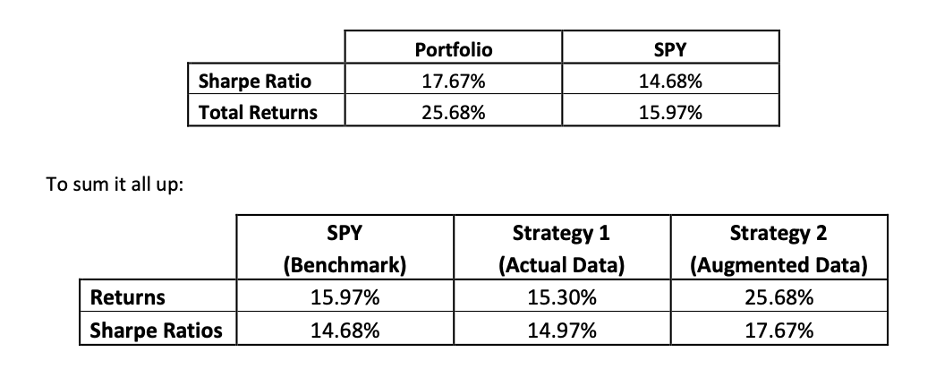
From the above results we can see that the returns and the sharpe ratio of the augmented data factor trading strategy is superior to those of the S&P 500 index and the actual data factor trading strategy.
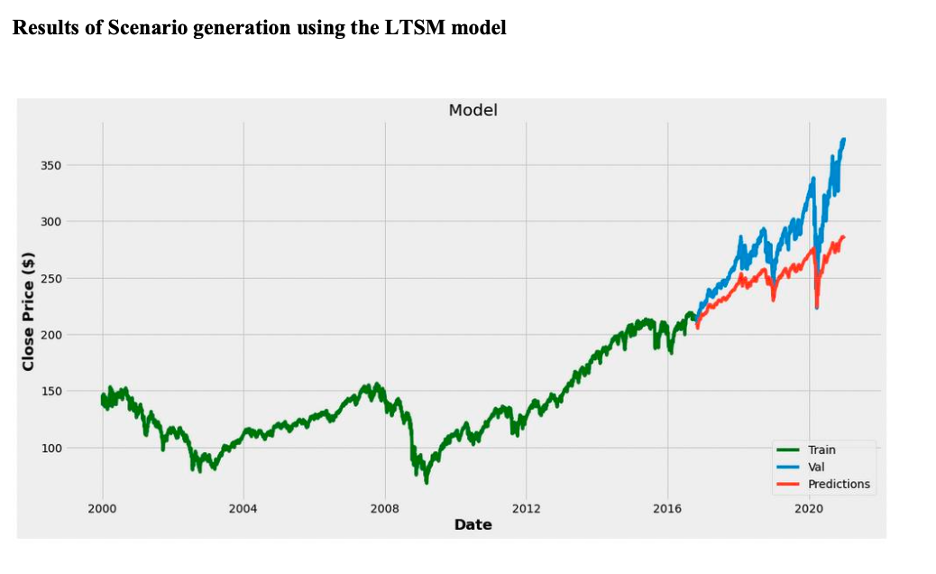
Results of Scenario Generation:
It was found that the Root Mean Square value of the GAN model was 35.73 whereas for the LSTM model it was 8.38. This shows that the LSTM model performed better than the GAN model, this is mostly because LSTM contains additional state to remember long and short term data, hence it knows which type of data to generate, whereas GAN only follows the distribution of data on which it is trained.
Data augmentation also enhances the prediction performance of the LSTM model. The results are depicted below:
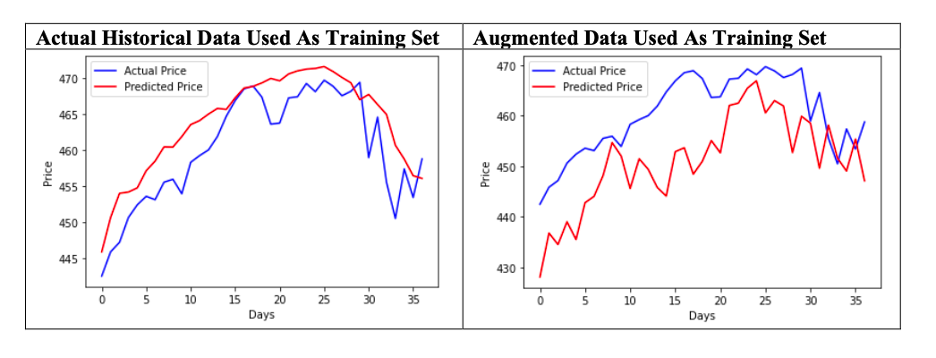
The data used in this case is the S&P 500 data from 2020-10-31 to 2021-11-30. 80% of the data is used for training and 20% for testing.
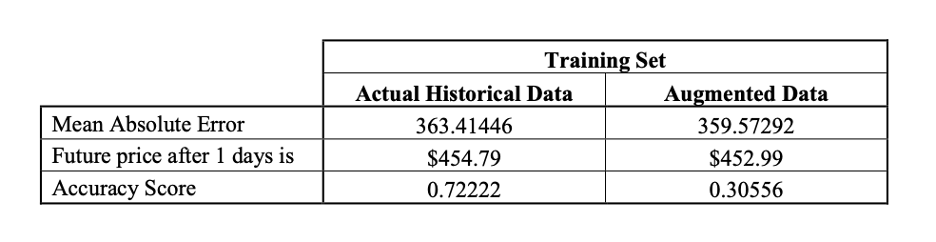
Augmenting training set reduces overfitting when training LSTM model and the absolute error for augmented data is found to be lower than with the actual data.
Risk Environment Assessment:
In this paper it was assumed that the market improves by 15% and has a risk free rate of 1.75%. The portfolio was shocked using CAPM with the help of the parameters from the linear model to determine the expected return. Assets with low beta and correlation showed low growth rate between 2% to 5% otherwise it was seen that if the market improves by 15% the portfolio return can increase by 11.5% to 15%.
Similarly, after computing the expected return of 0.000337663 from the LSTM model and the expected return of -0.0032627 from augmented models. The portfolio was shocked again using CAPM to evaluate the impact and differences of both models. Expect for the last four assets, which showed robust evaluation, the remaining assets for both the models had similar growth rates with a minimal difference.
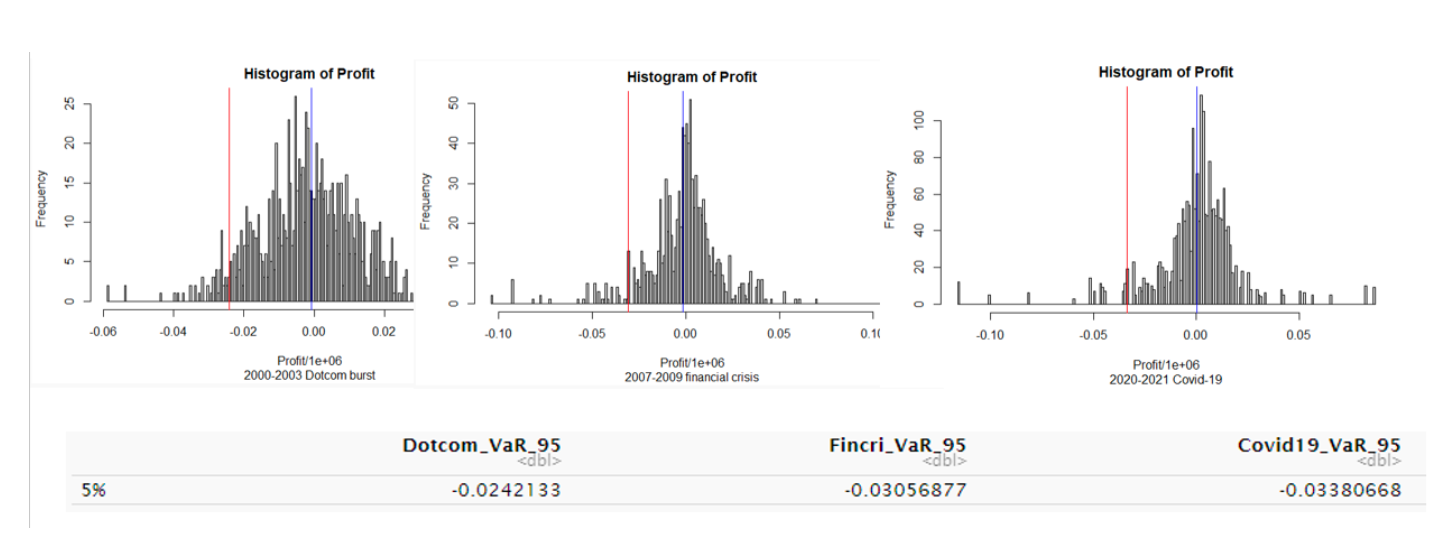
VAR was determined for different recession periods using the Monte Carlo simulation. It was seen that the risk increased as the number of simulation increased. This analysis was to determine how much value of the portfolio would be lost during crisis. It was found that highest loss occurred during the COVID-19 crisis.
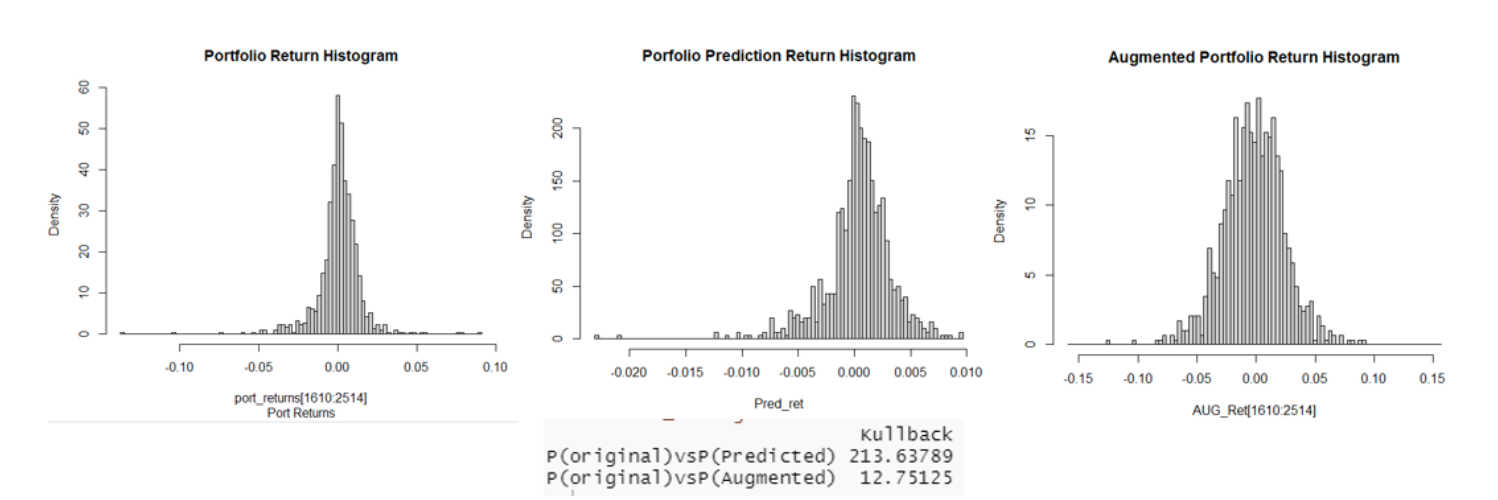
Finally, Kullback Lieber divergence was performed to measure the distance of the models to the original data. As per the KL divergence method, the closer the value is to 0, the better the new data matches the actual data. KL-divergence is very high for both models, even though the distance between augmented and original data is comparatively lower.
Conclusion:
The factor trading strategy developed using the augmented historical data is at least as good a the factor trading strategy developed using the actual historical data and in both the cases it performs better than thee S&P 500 index.
The LSTM model is better suited than time GAN model for generating financial time series data scenarios. The LSTM results can be improved by running it on the augmented data which results in lower absolute mean error owing to reduction in over fitting.