Researchers:
Liyuan Cao
Bejoy Shah
Jun Xie
Faculty Advisors:
Cristian Homescu
KhaldounKhashanah
Abstract:
This research introduces a new method for improving how investment portfolios are put together, using network and clustering techniques. The goal is to create portfolios that are more diverse and perform better in terms of risk and return, compared to traditional methods. The paper tests two clustering algorithms (K-means and hierarchical clustering) and two network algorithms (Louvain method and minimum spanning tree) for selecting assets. It also examines how these algorithms work with three different ways of distributing investment weights: equal-weighted, mean-variance, and hierarchical risk parity (HRP). The findings indicate that these new methods can make portfolios more varied, which leads to better performance when considering both risk and return.
Methodology:
1) Network-Based Asset Selection
1.1) Louvain Community Detection
This method uses the Louvain algorithm, known for identifying communities in large networks. It's applied here to find groups of assets with similar risk and return profiles in financial markets. By analyzing assets' correlations, the algorithm divides them into communities with high similarity within a group and low similarity between groups. Choosing one asset from each community creates a diversified portfolio, reducing risk while maintaining exposure to varied returns.
1.2) Minimum Spanning Tree (MST) Method
MST is a graph-based technique used to analyze financial markets. It constructs a tree connecting all data points (assets) with the minimum overall correlation, helping to identify relationships and clusters of assets based on their similarities. This method has been used to study stock correlations and build optimal portfolios. By showing how stocks are interconnected, MST allows for the creation of portfolios that are diversified across different market segments, balancing risk and market exposure.
2) Clustering-Based Asset Selection
2.1) K-Means Clustering Method
This widely-used technique groups data points (in this case, assets) based on their proximity to the cluster's center, or centroid. It's effective in identifying assets with similar risk and return characteristics. By selecting a representative asset from each cluster, portfolios can be diversified, balancing risk and return. This method has been applied in financial areas like portfolio optimization and asset allocation, where stocks are grouped based on returns and then used to construct diversified portfolios.
2.2) Hierarchical Clustering Method
This technique builds a hierarchy of clusters based on the similarity or dissimilarity between data points. It's useful for identifying groups of assets with similar risk and return characteristics. The hierarchical clustering method has been employed in various financial analyses, including stock correlation analysis and constructing minimum spanning trees to show financial market structures. By choosing representative assets from each cluster, this method helps create a well-diversified portfolio that balances risk reduction with exposure to different returns, leading to more efficient portfolio management.
3) Weight allocation methods
3.1) Equal-Weighted Method: This is the simplest approach where each asset in the portfolio is given the same weight. It's easy to implement and ensures diversification by avoiding over-concentration in any single asset. However, it does not consider the unique risk-return characteristics of each asset.
3.2) Mean-Variance Optimization: Introduced by Markowitz in 1952, this more complex method aims to optimize the portfolio by minimizing variance while targeting a specific expected return. It considers both the expected returns and the covariance matrix of asset returns, leading to a more efficient risk-adjusted allocation. However, this method can be sensitive to estimation errors in its inputs, potentially leading to unstable or concentrated portfolios.
3.3) Hierarchical Risk Parity (HRP): Proposed by López de Prado in 2016, HRP focuses on the hierarchical structure of assets. It uses hierarchical clustering to group assets by risk characteristics and then applies inverse-variance allocation within each group. This method seeks to address estimation errors and concentration risks found in mean-variance optimization, while still maintaining diversification. HRP is known for providing more robust and stable portfolio allocations by considering the hierarchical relationships among assets.
Implementation:
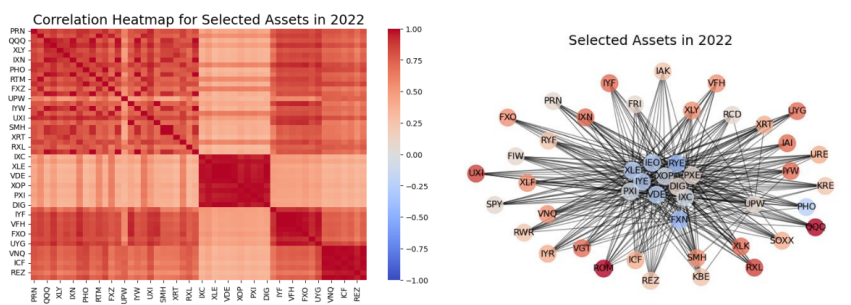
In the research, 105 ETFs from 11 sectors of the U.S. stock market were analyzed using daily data from 2008 to 2022 to study portfolio diversification.
1) Asset selection algorithms
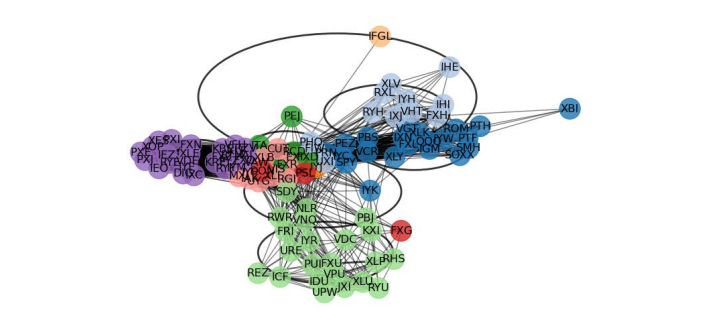
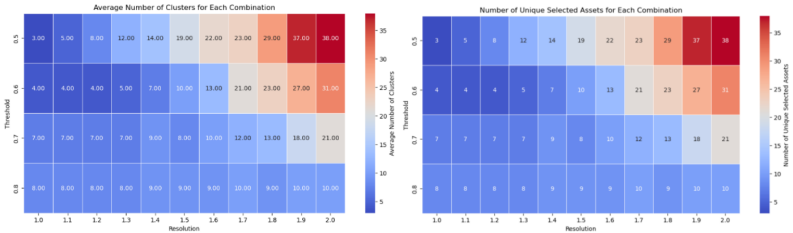
1.1) Louvain Community Detection Asset Selection
The Louvain community detection algorithm was used for asset selection, focusing on the correlation structure of assets within a yearly sliding window. This method involved adjusting threshold and resolution parameters to balance diversification and exposure to a range of assets. The sensitivity analysis of these parameters was crucial in optimizing the algorithm, as demonstrated by visualizations showing the impact on the number of clusters and unique assets selected. This approach allowed for the creation of diversified portfolios by choosing representative assets with high intra-group correlation and low inter-group correlation, enhancing risk management and portfolio performance.
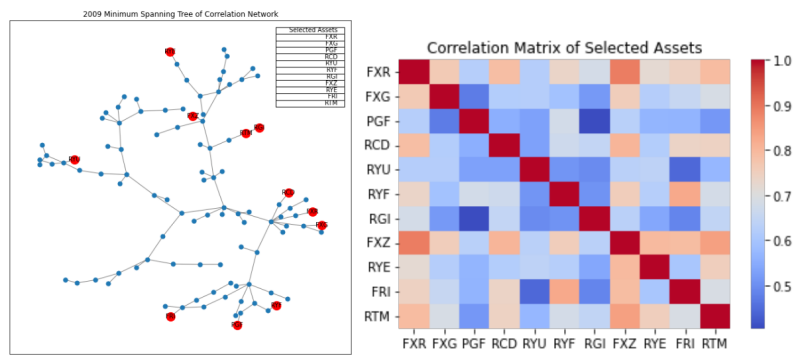
1.2) Minimum Spanning Tree average pairwise distance for asset selection
A portfolio construction algorithm using the minimum spanning tree (MST) method is developed based on the dissimilarity matrix of asset returns. This matrix is derived by transforming the correlation matrix into a measure of dissimilarity, where higher values indicate greater differences between assets. Using NetworkX, a graph is created where each asset is a node, and the edges represent the dissimilarities between them. The MST is then calculated using Prim's algorithm, identifying a set of assets with the lowest overall dissimilarity, thus ensuring portfolio diversification. The algorithm selects 11 assets with the highest average dissimilarities to form diversified portfolios. These selected assets are visually highlighted in a plotted MST, making the asset selection process clear. This method allows for the construction of diversified portfolios by focusing on assets with significant differences in their return profiles.
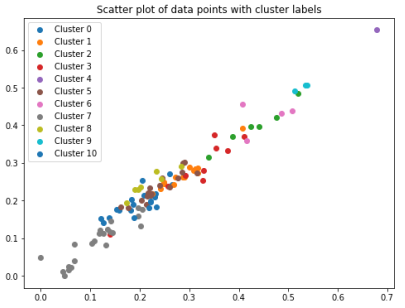
1.3) K Means Clustering using similarity score for asset selection
K-means clustering algorithm is implemented to create diversified portfolios. It transforms the correlation matrix of asset returns into a distance matrix to facilitate clustering based on similar risk and return profiles. The algorithm arranges assets into 11 clusters, with each cluster's dispersion from the market average and internal correlation assessed to calculate a diversity score. Clusters with the lowest similarity scores, indicating higher diversification potential, are prioritized for portfolio construction. The study also examines how the chosen number of clusters affects portfolio returns, highlighting the importance of cluster selection in optimizing portfolio performance.
1.4) Clustering-based asset selection
The Hierarchical Clustering-based Asset Selection Algorithm employs the elbow method to determine the optimal number of clusters, striking a balance to avoid overfitting or underfitting. This strategy aids in selecting the most suitable assets for diversification, thereby reducing risk and potentially enhancing returns. Additionally, it considers both the average pairwise correlation and the total return of the assets, ensuring the selected portfolios are not only high-performing but also well-diversified. This comprehensive approach effectively minimizes portfolio risk while promoting long-term stability.
Results:
To evaluate portfolio performance, the study sets up back tests comparing traditional optimization models with those using clustering and network analysis techniques. Portfolios are built using equal-weighted, mean-variance, and HRP optimizations, and assessed using seven measures including cumulative return, max 10-day drawdown, volatility, Sharpe ratio, value at risk (VaR) at 95% and 99% confidence levels, and conditional value at risk (CVaR) at 95%. This comprehensive approach aims to establish the effectiveness of clustering-based methods in portfolio construction.
1) Louvain’s Method Backtest Observations
In the backtest results for portfolios using Louvain's method combined with different optimization models, it was observed that Louvain combined with mean-variance optimization significantly improved cumulative returns (from 164.54% to 438.07%) with a manageable increase in volatility, indicated by a Sharpe Ratio of 0.90688. Portfolios using Louvain with hierarchical risk parity (HRP) optimization yielded the highest cumulative returns, although with higher volatility compared to equal-weighted and mean-variance optimizations. Despite higher volatility, HRP achieved a better Sharpe ratio than equal-weighted but lower than mean-variance. The equal-weighted optimization showed the lowest VaR and CVaR, suggesting lower risk, followed closely by HRP, while mean-variance lagged in these measures. Overall, HRP emerged as the most effective model in balancing high profitability and acceptable risk levels.
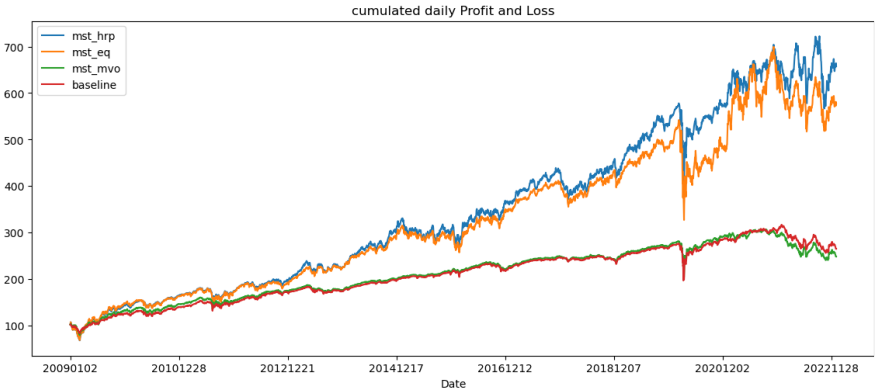
2) MST (Minimum Spanning Tree) Backtest Observations
In the backtest using the Minimum Spanning Tree (MST) method, it was found that MST combined with mean-variance optimization underperformed compared to the baseline, resulting in lower cumulative returns and higher volatility, leading to a reduced Sharpe ratio. However, MST did show marginally better performance in terms of lower 95% and 99% VaR and CVaR than the baseline, suggesting some risk management benefits. When comparing different optimization models with MST, the hierarchical risk parity (HRP) optimization yielded the highest returns and Sharpe ratio, significantly outperforming mean-variance optimization. Equal-weighted optimization also performed better than mean-variance but was slightly behind HRP in terms of returns and volatility. Both HRP and equal-weighted optimizations resulted in negative VaRs and CVaR, indicating potential profitability at the chosen confidence level. Thus, MST is most effective when paired with HRP optimization, while its combination with mean-variance optimization does not necessarily enhance performance.
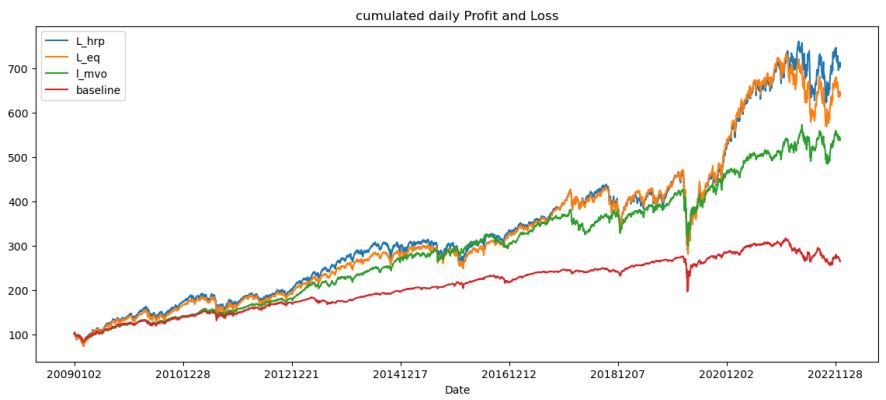
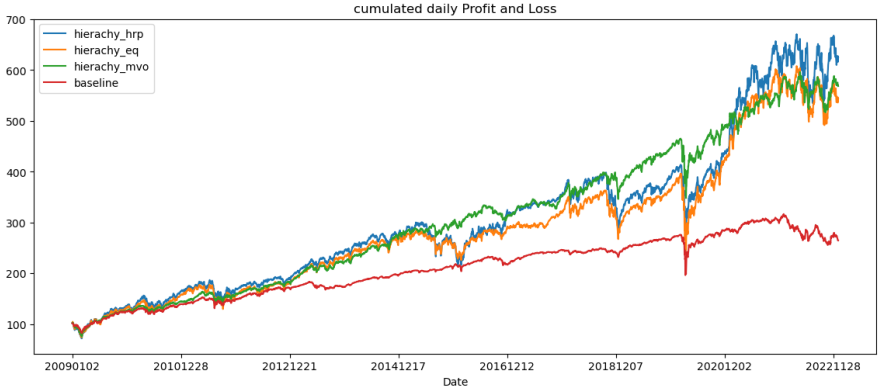
3) Hierarchy Clustering Backtest Observations
In the backtest with Hierarchical Clustering, the combination with mean-variance optimization showed a remarkable improvement, achieving a 4.684 cumulative return (up from the baseline's 1.6454, a 284.5% increase), with only a 2% increase in volatility. This resulted in a Sharpe ratio leap from 0.6507 to 0.9581. While the HRP optimization yielded the highest returns, it also had significantly higher volatility, leading to a lower Sharpe ratio. In contrast, the equal-weighted model didn't outperform mean-variance in returns despite higher volatility. The mean-variance optimization paired with Hierarchical Clustering achieved an almost incomparable Sharpe ratio, making it challenging to determine the superior model between it and HRP, considering both returns and risk-adjusted performance.
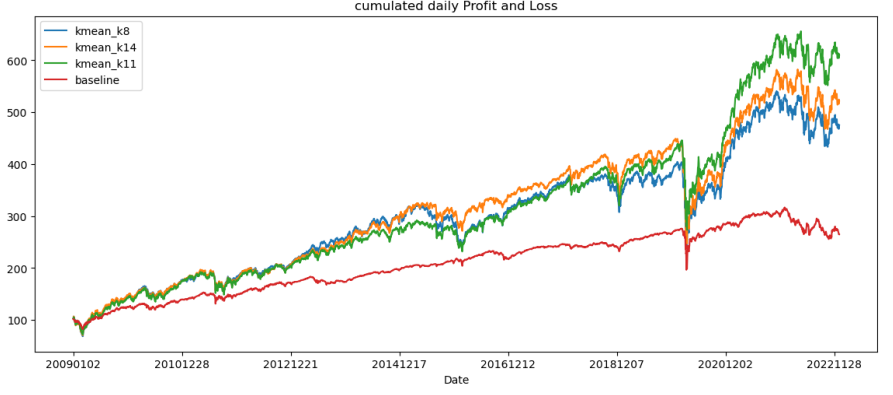
4) K-mean Backtest Observations
In the K-mean clustering backtest, using 11 clusters (K=11) was identified as optimal, offering the highest cumulative return and Sharpe ratio. When combined with mean-variance optimization, K-mean significantly improved performance, with a cumulative return of 8.1368 compared to the baseline's 1.6454, despite a 9% increase in volatility. Additionally, both HRP and equal-weighted optimizations achieved higher cumulative returns (13.129 and 12.730, respectively) with similar volatility levels, resulting in almost identical and notably high Sharpe ratios. The performance measures, including VaRs and CVaRs, were also very similar for these models. This indicates that K-mean clustering, especially with 11 clusters, is most effective when paired with HRP optimization for portfolio construction.
Conclusion:
In conclusion, the backtest results demonstrate that Louvain’s method, Hierarchical Clustering, and K-mean clustering (with K=11) enhance the performance of portfolios optimized by mean-variance, offering more profitable and diversified outcomes compared to using mean-variance optimization alone. However, MST underperforms slightly when combined with mean-variance optimization, suggesting the need for further research into its construction. Conversely, when MST is paired with Hierarchical Risk Parity (HRP), a clustering-based optimization, it shows significant profit potential, outperforming both mean-variance and equal-weighted combinations. Similarly, Louvain’s method and K-mean clustering excel when paired with HRP optimization. Hierarchical Clustering with HRP doesn't show a distinct advantage over equal-weighted portfolios, but still outperforms both Hierarchical Clustering with mean-variance optimization and the baseline in terms of Sharpe ratio, cumulative return, and lower VaRs. The negative VaR values across all four asset picking methods when implemented with HRP suggest strong diversification, as it indicates minimal risk correlation among assets. This underscores that clustering and network analysis techniques, when combined with suitable clustering-based optimization models, significantly boost portfolio performance beyond traditional optimization approaches.