Researchers:
Zeyu Huang, Savio Pereira, Meiqi Liu
Advisors:
Dr. Ionut Florescu, Dr. Papa Ndiaye, Dan Wang
ABSTRACT:
Corporate credit rating prediction using machine learning techniques has been one of the attractive research topics in the literature. In recent years, multiclass classification methods such as Random Forest have become very appealing machine learning approaches due to their good results. This study focuses on the importance of feature selection for the prediction of corporate credit rating using a five-class rating model. We compared the results of two methods, the permutation feature selection method and the null importance feature selection method to identify important features that help in predicting corporate credit rating. The experimental results show that our proposed feature selection method improved classification accuracy in comparison to typical multiclass classification techniques without feature selection. The result also show that leverage ratios are the most influential features for prediction and that financial risk ratios are more significant than business risk ratios.
INTRODUCTION:
- Background: Credit ratings are widely used to assess investment risks and bond marketability. Traditional credit rating models rely on classical econometric methods. Machine learning has emerged as a powerful tool to extract valuable information from large datasets, offering a new approach to credit rating prediction. Feature selection is an important step in improving model accuracy and classification performance. This study explored two feature selection methods to identify common features that contribute to credit rating prediction.
- Literature Review: Researchers have applied machine learning to financial problems. Nemati Koutanaei et al. [1] compared machine learning classifiers and feature selection methods for rating prediction, finding that ensemble classifiers and PCA feature selection perform best. However, they did not identify significant features.
Huanga et al. [2] used support vector machines and neural networks for credit rating prediction, finding different significant features for U.S. and Taiwanese companies.
Hajek and Michalak [3] also developed a feature-selection-based credit rating prediction model, concluding that different features are important for U.S. and European companies.
Tsai and Hsiao [4] used feature selection techniques to identify important features for stock price prediction, finding that combining multiple feature selection methods can improve prediction performance compared to using single methods.
METHODOLOY:
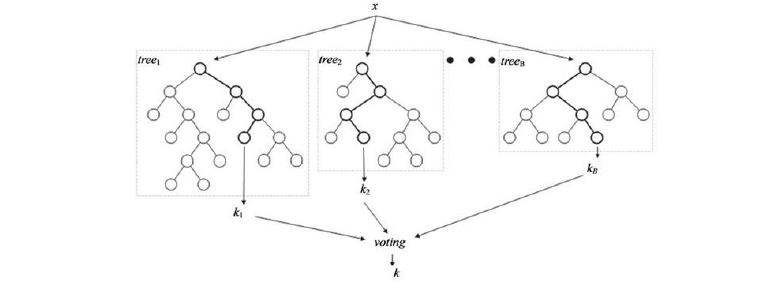
- RANDOM FOREST: Random forest, an ensemble learning method for classification, constructs multiple decision trees and outputs the most frequent class among them. This voting-like approach reduces overfitting. It employs bagging and a modified tree learning algorithm that selects random feature subsets at each split to generate uncorrelated trees. Out-of-bag error, a method for measuring random forest's prediction error, utilizes the unused training data during tree construction for validation. The out-of-bag error is calculated by averaging the prediction error over all trees.
2. BIAS AND IMPROVEMENT: Standard random forest classifiers employ standard classification trees, which exhibit two drawbacks. Firstly, they tend to favor continuous predictors with numerous levels, potentially masking more significant categorical predictors with fewer levels. Secondly, they may overlook crucial interactions between predictor pairs when multiple less important predictors exist. These issues arise when predictor levels vary significantly and interactions are strong. To address these limitations, we propose incorporating curvature and interaction tests into the tree construction process. The curvature test assesses the association between a predictor x and the target variable y by partitioning x into quarters and comparing the observed and expected class proportions. A p-value less than 0.05 indicates a significant association. The interaction test evaluates the interaction between predictors x1 and x2 with respect to y. It involves partitioning x1 and x2 into quarters, creating a new nominal variable z with 16 levels based on the combinations of x1 and x2 levels, and conducting a curvature test between z and y. A p-value less than 0.05 indicates a significant interaction.
During tree construction, the node splitting rules are modified as follows:
- If all p-values of the curvature and interaction tests are at least 0.05, the node is not split.
- If the minimum p-value results from a curvature test, the corresponding predictor is chosen for node splitting.
- If the minimum p-value results from an interaction test, the split predictor is determined using standard CART on the corresponding predictor pair.
This approach is robust to the number of levels in individual predictors.
3. FEATURE SELECTION:
a. Permutation Importance: Permutation importance is a method for measuring the influence of predictors in a classification model. It works by randomly shuffling predictor values and observing the change in model error. Influential predictors cause a significant increase in error, while uninfluential predictors do not. The increase in error is used as the importance score for that predictor.
To calculate permutation importance:
- For each tree in the random forest, identify out-of-bag observations and predictors used to split the tree. Estimate out-of-bag error and calculate the difference between permuted and original errors for each splitting predictor.
- Calculate the mean and standard deviation of these differences over all trees for each predictor.
- The permutation importance score is the mean difference divided by the standard deviation.
b. Null Importance: Permutation importance is a method for measuring the influence of predictors in a classification model. It works by randomly shuffling predictor values and observing the change in model error. Influential predictors cause a significant increase in error, while uninfluential predictors do not. The increase in error is used as the importance score for that predictor.
However, permutation importance does not provide a criterion for determining which features are important. Null importance feature selection addresses this issue by setting a threshold to determine which features can be dropped.
The process for implementing null importance feature selection is as follows:
- Calculate the permutation feature importance score for every predictor.
- Calculate null importance score. Randomly permute the values of the target variable and then remeasure the permutation importance score for every predictor.
- Create the null importance distributions. Repeat step 2) 200 times to get the distribution of null importance score for every predictor.
- Set the threshold to determine which predictors should be dropped. Compare the actual permutation importance score with the 95th percentile of the null importance score distribution for each predictor. If the actual score is smaller than the 95th percentile, the feature can be dropped.
DATA COLLECTION AND PRE-PROSESSING:
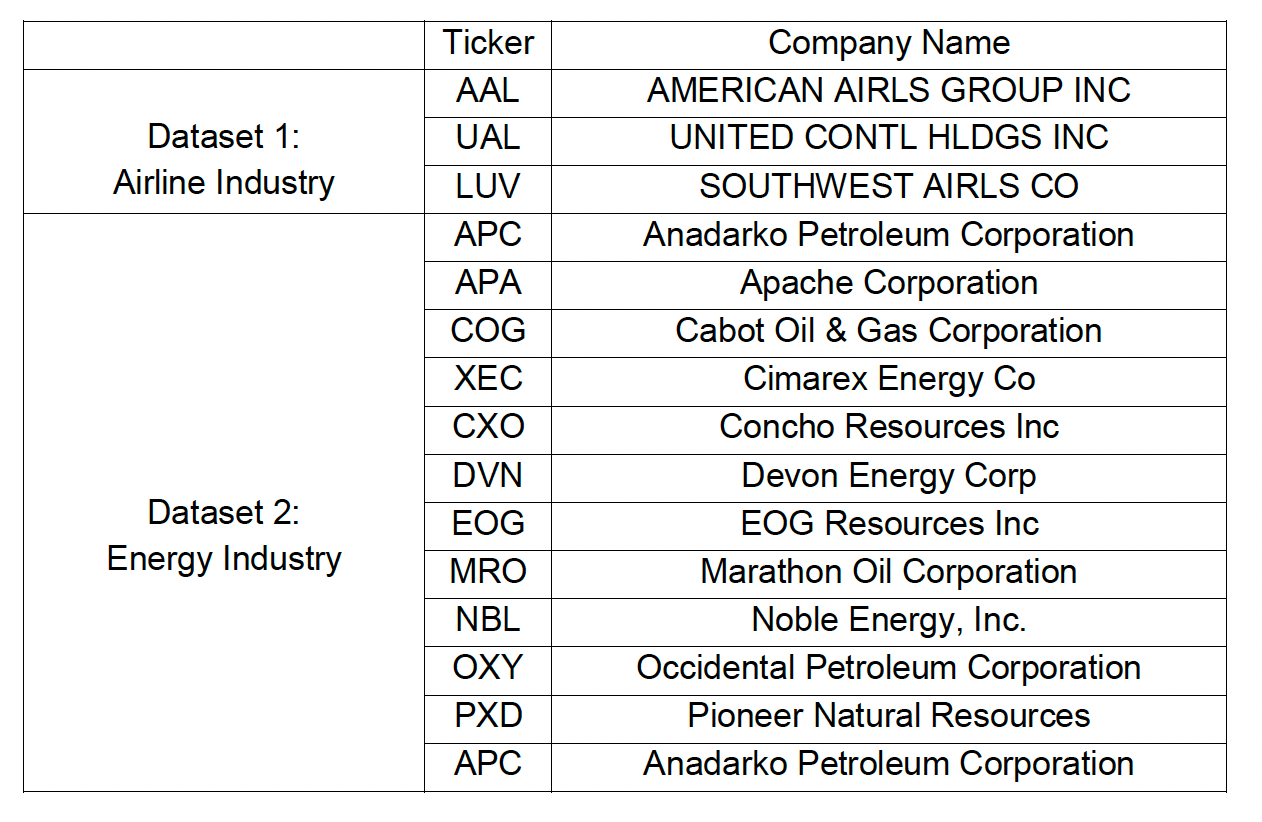
This project utilizes data from two industries: airlines and energy. Industry risk is a crucial factor in credit ratings, as discussed in the introduction. However, the study focuses on financial ratio predictors, necessitating a sector-specific analysis of credit ratings to exclude industry risk's impact. Table below lists the companies included in the two datasets.
Financial Data Ratio:
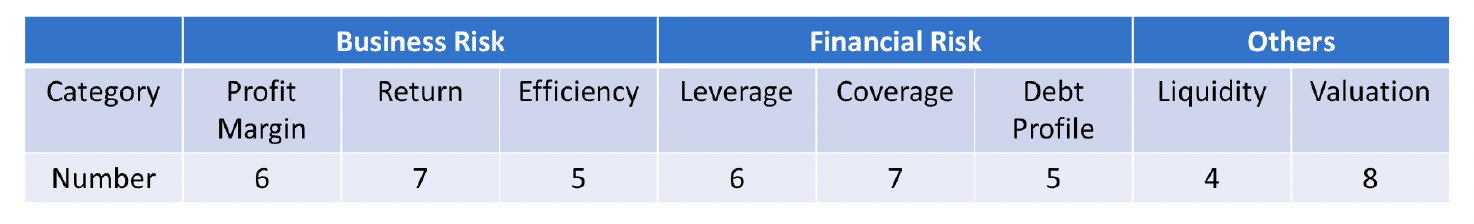
The WHARTON RESEARCH DATA SERVICES (WRDS) database, Financial Ratios Suite, offers historical company quarterly financial ratios data sorted by categories. The original categorization of ratios is inadequate, so we reclassified them into eight categories. Additionally, we observed that ratios within each category may exhibit high correlation due to their overlap in measuring similar aspects of a company's financial performance. Consequently, we excluded ratios with significant missing values and opted for alternative ratios with fewer missing values. We carefully selected 48 ratios from the eight categories, as detailed in Table below. According to S&P's rating process disclosure, profit margin, return, and efficiency ratios are employed to assess business risk, while leverage, coverage, and debt profile ratios are used to gauge financial risk. Liquidity and valuation ratios, on the other hand, may be employed as modifiers to influence the rating decision anchor established in the rating process's initial phase.
Other Features:
An analysis of airline and energy industries revealed similar financial ratios but lower credit ratings for airlines. Business risk profile and overall performance were addressed by incorporating company market capitalization, industry market capitalization, and oil prices. Quarter-ending prices were used due to financial statement release delays.
Historical credit rating data:
The emergent Fixed Income Securities Database (FISD) serves as a repository for historical ratings of publicly traded U.S. bonds. In the realm of credit ratings, multiple ratings are often associated with a particular corporate entity. For instance, each debt instrument receives a rating, and even the issuer itself is assigned a rating. It is crucial to note two key aspects: firstly, all senior unsecured bonds issued by a company share the same rating, and secondly, the ratings of senior unsecured bonds are attributed to the company and are referred to as the company's rating. Therefore, the rating we aim to predict in this paper is the company's rating.
DATA TRANSFORMATION
Five-class transformation of credit ratings
To develop a five-class credit rating prediction model, first categorize the original ratings into five groups based on the historical ratings distribution. This categorization aims to balance the dataset relative to the target variable, which is the transformed ratings.
Percentage rank transformation of features
To develop a rating change prediction model, we transform the features using percentile ranking. This is necessary because SVM and Random Forest algorithms treat each record independently, and we need to establish a connection between the current record and its predecessors. Percentile rank assigns a value to each record based on its position within the distribution of the feature.
Problems with using random stratified sampling for the test dataset
When using models like SVM and Random Forest for credit rating prediction, randomly selecting a portion of the original dataset for testing can introduce biases. These models establish decision boundaries during training, making it easier for them to classify records from the same dataset, leading to inflated performance estimates. To mitigate this issue, the test dataset should be independent of the training data, ensuring that the model's performance is evaluated on unseen data.
FIVE CLASS RATING PREDICTION MODEL
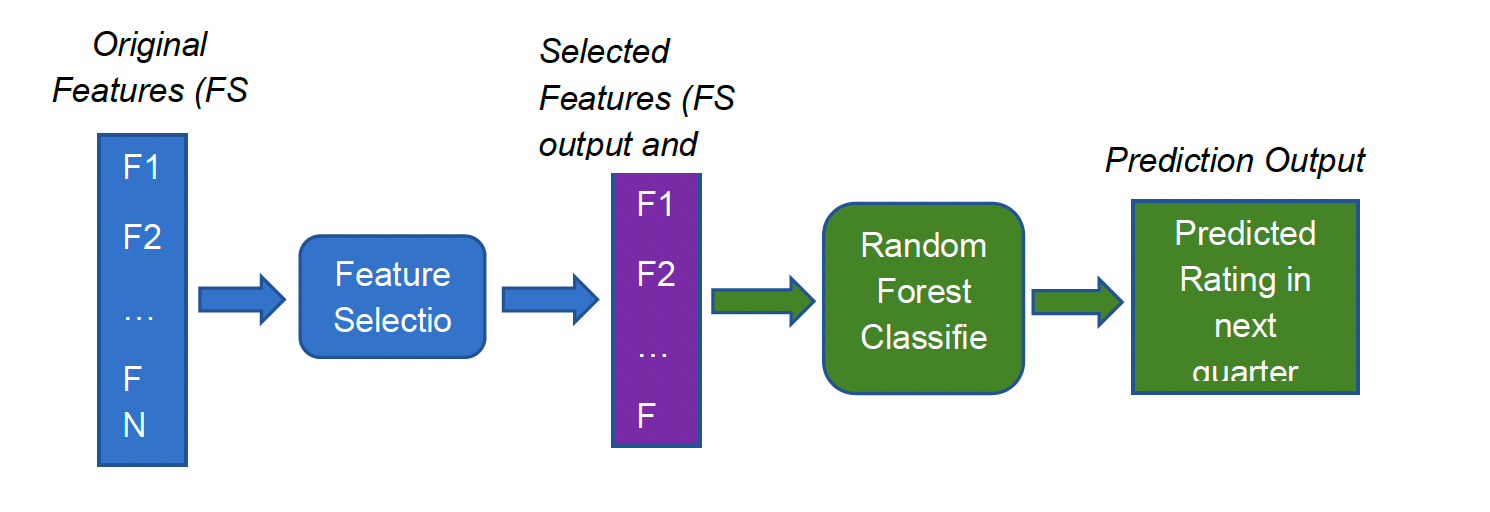
To predict credit ratings and identify crucial features affecting the rating process, we constructed a five-class rating prediction model. This model utilizes quarterly financial data of companies to anticipate the transformed credit rating for the subsequent quarter. The enhanced random forest machine learning classifier discussed in section 2.1.2 is employed in this model. Moreover, we perform feature selection to identify essential features and prevent overfitting issues. The model's framework is as follows:
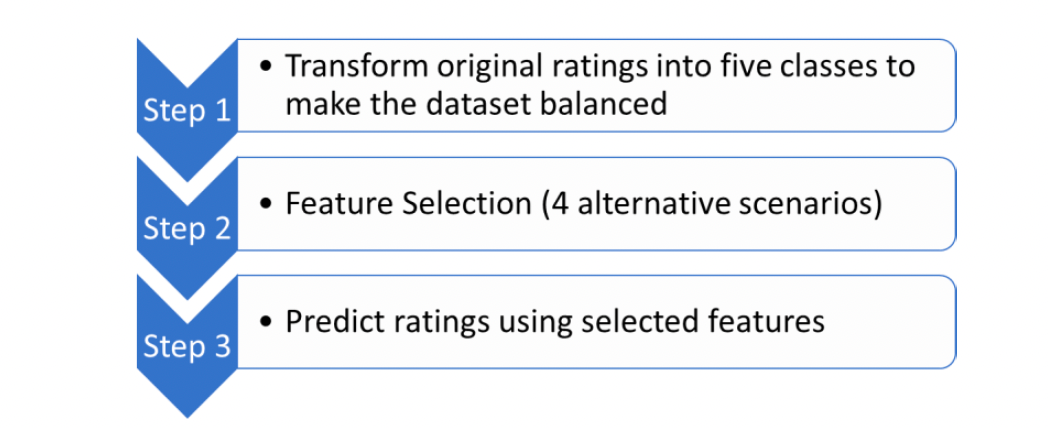
Rating Transformation: Original ratings are transformed into five classes. Standard & Poor's rating service assigns twenty-one rating notches to companies and long-term debt, ranging from AAA to D. Since our model primarily utilizes ratios as features, expecting a twenty-one-class model to perform well is unrealistic. Hence, we implement a simplified five-class model that can still aid in identifying important features. Additionally, certain rating notches are scarce in the data, resulting in an imbalanced dataset relative to the response variable. To ensure the robustness of the machine learning model, we combine these infrequent notches with other more prevalent ones.
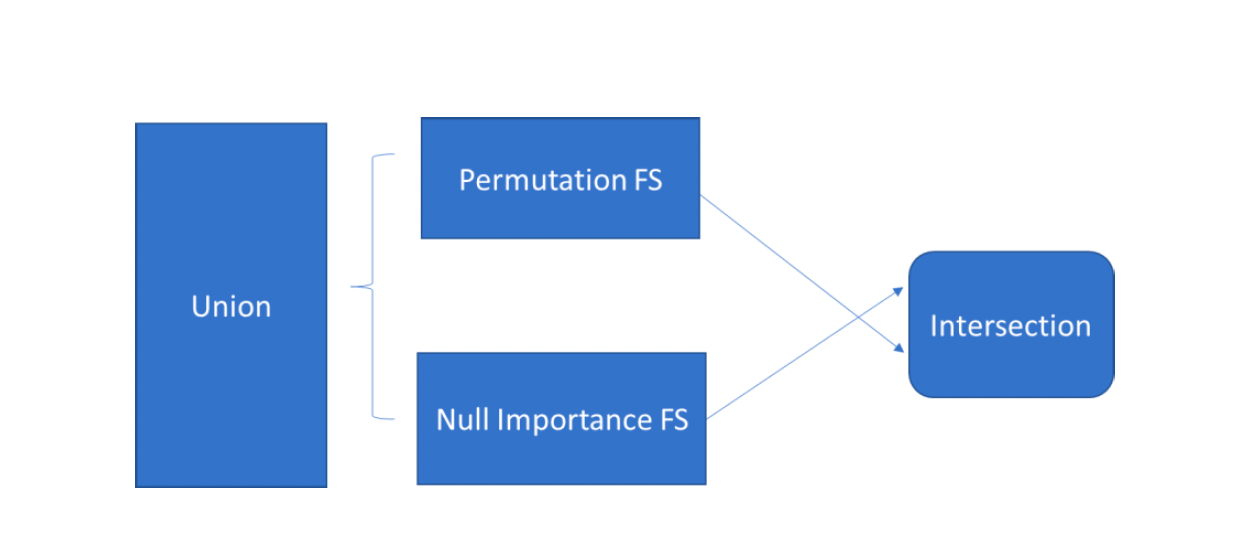
Feature Selection: Two feature selection methods are implemented: permutation importance and null importance. The mechanisms of these two methods are discussed in section 2.2. In addition to the two feature selection methods, we can also consider the union and intersection of the results from these two methods. Consequently, we have a total of four feature selection scenarios: permutation FS, null importance FS, the union set, and the intersection set. In the results section of this paper, we compare these four scenarios to the baseline scenario with no feature selection.
Rating Prediction: We predict the credit rating into five classes using the selected features. In summary, the entire model can be summarized in three steps.
SUMMARY AND ANALYSIS
A comparative analysis of empirical results from the airline and energy industries revealed several common themes.
Leverage Ratios as Key Predictors: Leverage ratios emerged as the most influential features for credit rating prediction. This prominence stems from their pivotal role in assessing a company's default risk. Consequently, it suggests that leverage ratios are likely the primary factors considered by rating agencies when evaluating a company's financial health.
Financial Risk Ratios Take Precedence: Financial risk ratios demonstrated greater significance compared to business risk ratios. Our research focused on analyzing rating issues within specific industry sectors, excluding industry-level data. This limitation resulted in less comprehensive business risk features compared to financial risk features. As a result, business risk ratios in our data may not fully capture the complete picture of business risk. Additionally, it's possible that rating agencies place greater importance on financial risk features when assessing a company's creditworthiness.
Return Ratios Play a Secondary Role: Return ratios exhibited less significance compared to margin ratios. This could be attributed to the relative ease of manipulating return ratios compared to margin ratios. For instance, the return on assets (ROA) ratio, defined as net income divided by total assets, can be artificially inflated by overstating net income or understating assets. Conversely, margin ratios are less susceptible to manipulation as they measure the proportion of income to total sales. Manipulation would require inflating sales or understating costs, both of which could also impact return ratios. Notably, rating agencies tend to favor operating income measures when evaluating a company's business risk. However, return ratios consistently use net income as the numerator, which is more volatile and unpredictable than operating income.
Feature Selection Enhances Accuracy: Feature selection techniques demonstrated the ability to enhance prediction accuracy. Our feature selection methods consistently improved the accuracy of the prediction model for both the airline and energy industries.