Abstract
The topic of our project is multi-asset portfolio management, our portfolio contains three asset categories, these are equities, fixed income and commodities, and in total 14 assets. We want to obtain a diversified portfolio and use different portfolio optimization methods to find the optimal portfolio, compare its performance with SPY, and compare the return and risk performance of all optimal portfolios that generated from different optimization approaches with each other. The portfolio allocation methods we employed are naive portfolio allocation, mean-variance optimization, Black-Litterman model, robust optimization method, and two machine learning approaches: long short-term memory and genetic algorithm. Meanwhile we analyze how the different length of time series data as input affect the optimal portfolio allocation and its performance, also analyze the influences of historical data that come from different market environments on the optimal portfolio allocation and performance. Then tune the parameters of each optimization method, find out the advantages and disadvantages of each method, provide some advice for the multi-asset portfolio optimization in practice.
Authors:
- Encheng Liu
- Li Liao
- Tianao Xu
Supervisor:
- Dr. Khaldoun Khashanah
Mean-Variance Optimization
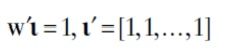
Mean-variance optimization is the approach where investors optimize a trade off between risk and return. We applied the risk-aversion formulation of the classical MV optimization. The framework is
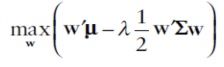
given
where
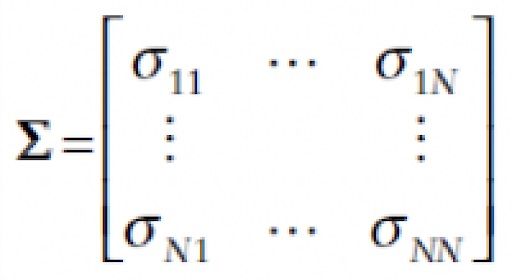
is the co-variance matrix, and λ is the risk-aversion coefficient.
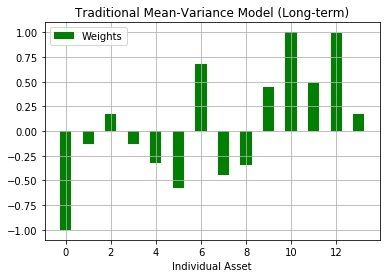
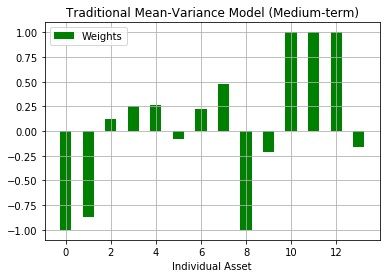
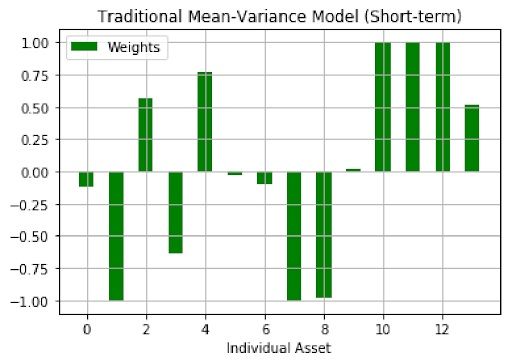
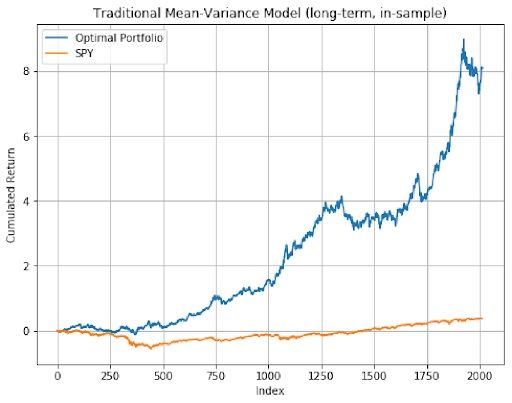
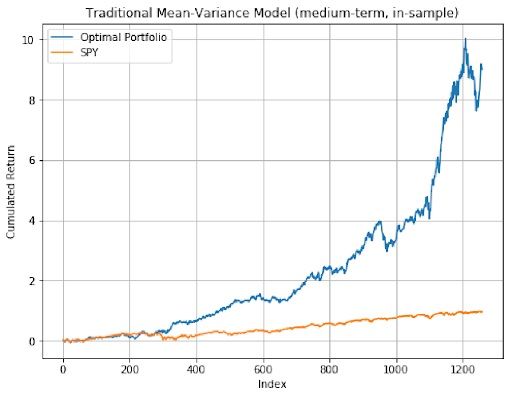
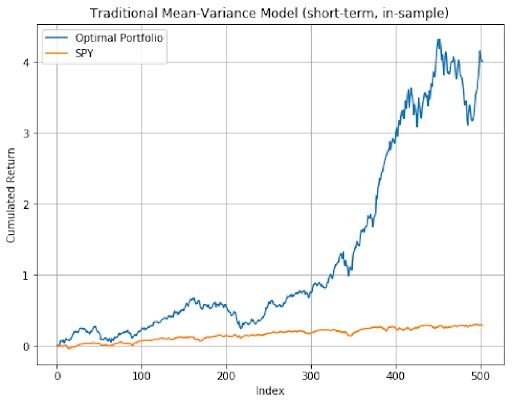
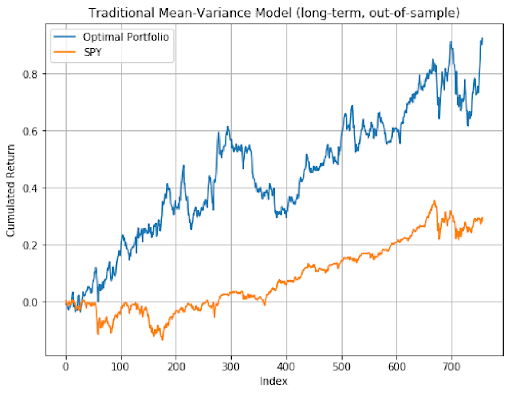
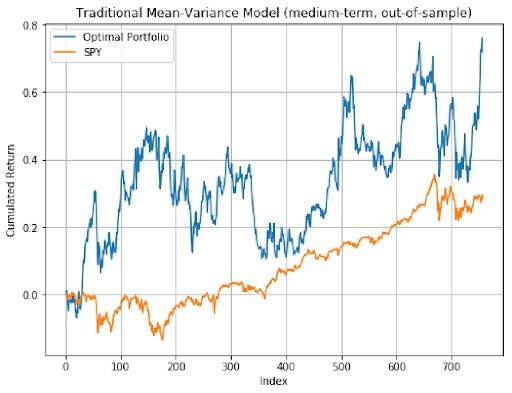
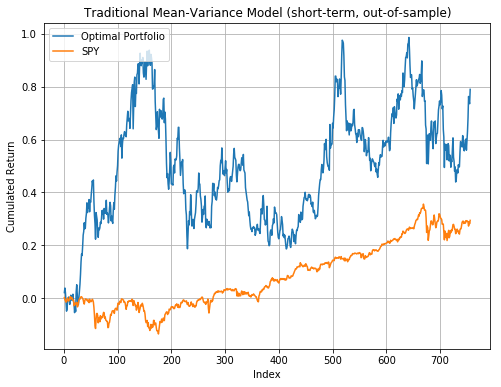
The mean-variance optimal portfolio outperformed SPY in general. In out-of-sample analysis, long-term model had the best performance as it resulted in the highest sharpe ratio. Therefore, Mean-Variance optimization had a much better outcome compared to the equal-weighted strategy and Mean-Variance portfolios presented better performance in longer time periods.
Black-Litterman Model
After processing the collected views, we implemented them into our Black-Litterman model and constructed one portfolio for each time period. Then we back tested our portfolios with in-sample data which are the daily prices from 2007-06-01 to 2015-06-01, 2010-06-01 to 2015-06-01, and 2013-06-01 to 2015-06-01. The followings graphs show the performance of each portfolio.
Then we have backtested our portfolios with out-of-sample data which is the set of daily prices from 2015-06-01 to 2018-06-01. The following table shows the performance of the portfolios.
Compare with the performance of SPY, all our portfolios have outperformed SPY and have some high cumulative returns in 25 months. And again, the mid-term portfolio has the best performance. But one thing we need to pay attention is that the performances of our portfolios are very volatile. For example, the highest point for the short-term portfolio is around 0.80 and the lowest point is around -0.13. This shows the risks of the portfolios are very high and there could be potentially high losses.
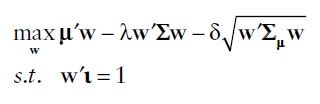
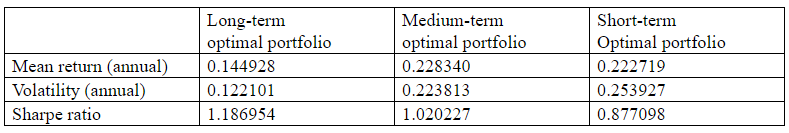
Robust Optimization
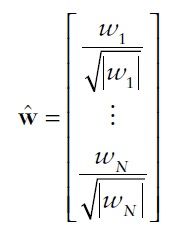
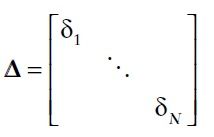
We use robust optimization try to minimize the worst-case expected portfolio return, in our robust version of mean-variance formulation, assets whose mean return estimates are less accurate (have a larger estimation error delta) are penalized in the objective function, and will tend to have smaller weights in the optimal portfolio allocation.
When we choose different uncertainty set for expected return, we will get different optimization framework, there are two uncertainty sets which used more frequently:
(a)
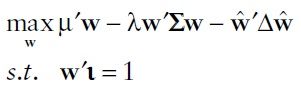
The first two terms are similar as the traditional mean-variance optimization framework, the third term can be interpreted as a risk adjustment performed by an investor who is averse to estimation error.
(b)
As we can see, the first two terms are similar as the optimization framework of traditional mean-variance method. And we can interpret the third term as the penalty for estimation risk. Protect investor from worst-case scenario.
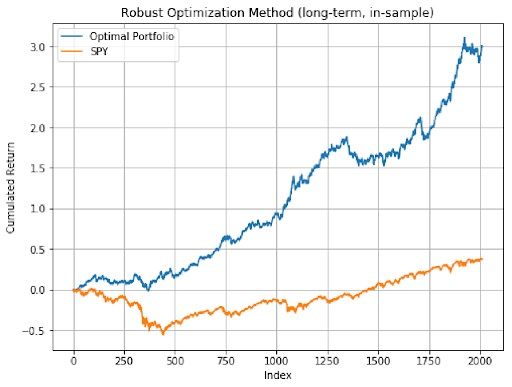
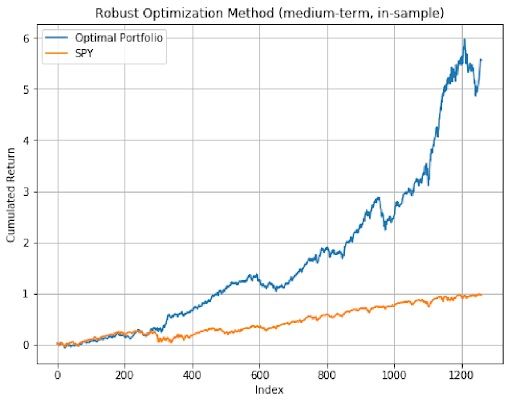
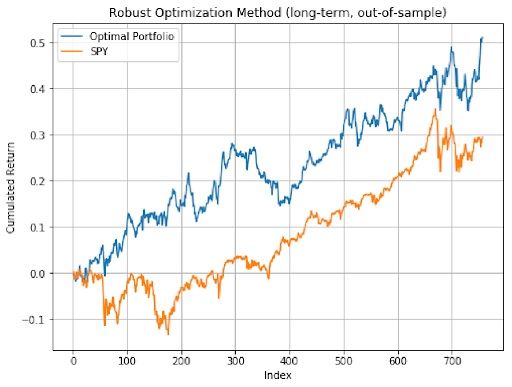
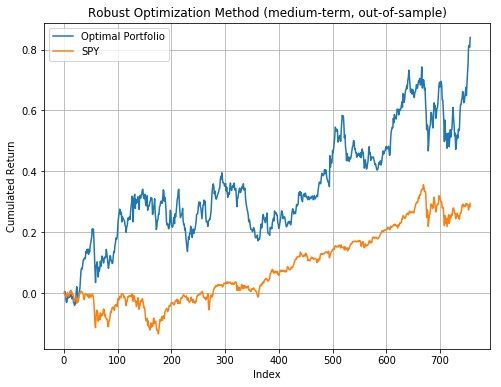
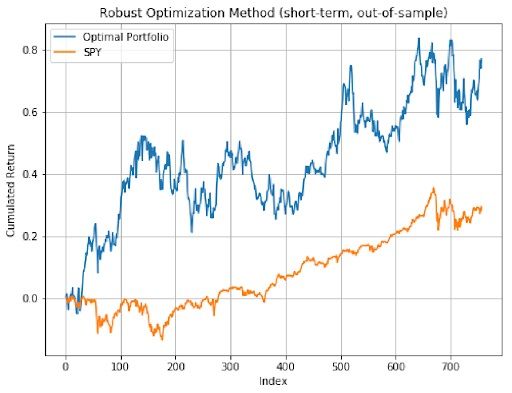
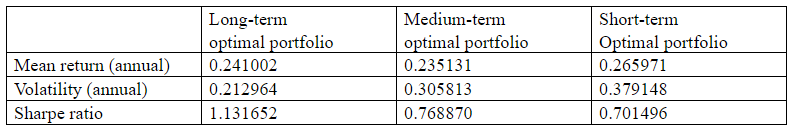
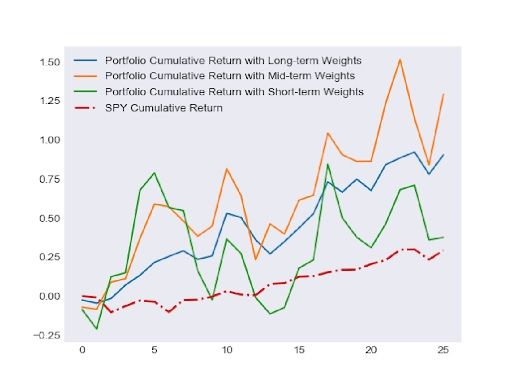
As we can see from the three plots above, both the medium-term and the short-term portfolios have better performance than long-term optimal portfolio, and all three optimal portfolios’ performance beat the market which is SPY.
Machine Learning: Long Short-Term Memory
Forecasts next month’s daily prices for each asset in our portfolio, then use this time series data as in-sample data to construct the optimal portfolio, here we used two methods to do the construction, first is traditional mean-variance optimization, second is robust optimization.
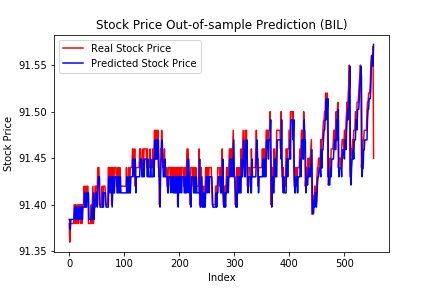
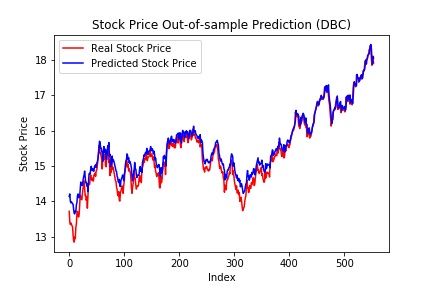
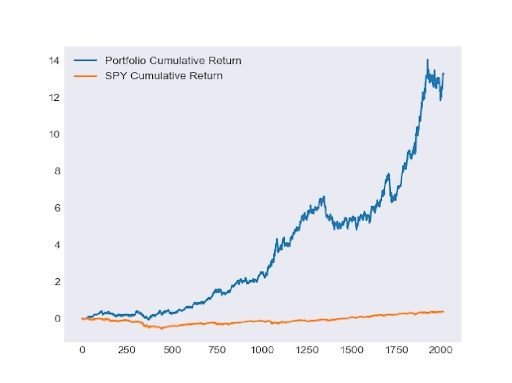
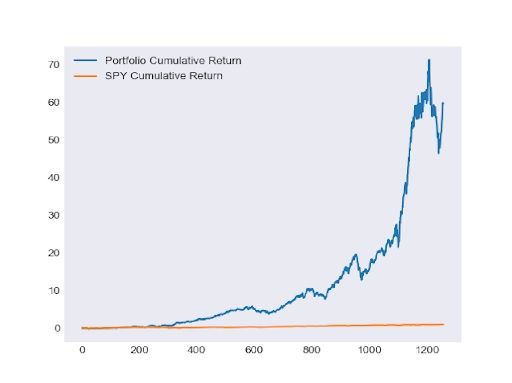
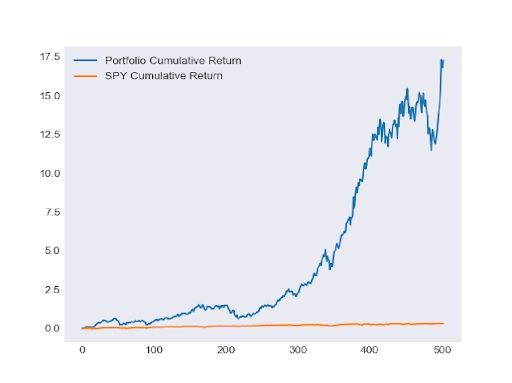
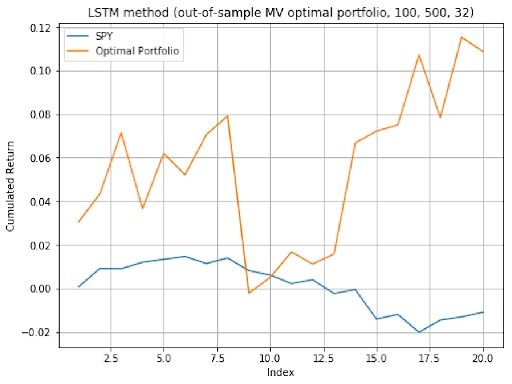
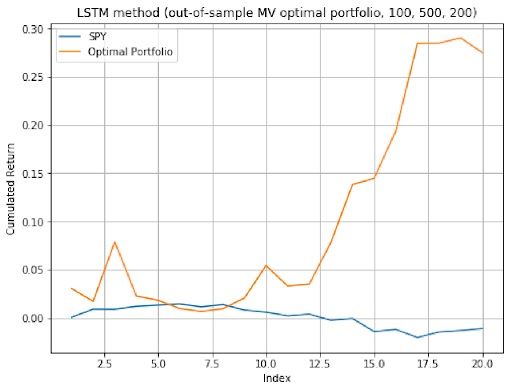
The following 2 plots are the out-of-sample performance of the optimal portfolios, their weights of the 14 assets in each optimal portfolio are result from the predicted assets price in the previous step.
Machine Learning: Genetic Algorithm
Authors apply Genetic Algorithm to seek for best portfolio. Each portfolio is regarded as an individual unit. Authors design processes of mutations and reproductions for portfolio. Performance of portfolio is evaluated by Mean-Variance objective function.
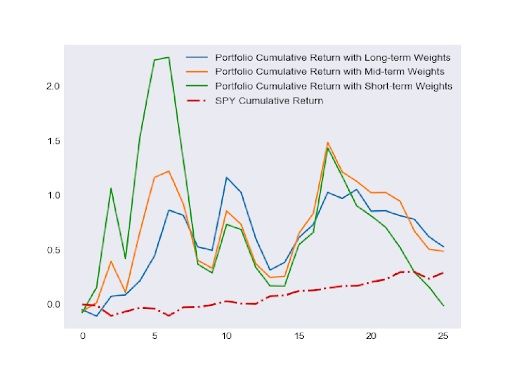
As we can observe from the graph, the performances of our portfolios with out-of-sample data are very good. Although they are very volatile, all three portfolios outperformed the benchmark which is SPY ETF. The most volatile portfolio is the short-term portfolio since it has the highest point around 2.25 and the lowest point which is lower than 0.
Conclusion
The ultimate goal of our project is to find the proper allocation strategies to construct the portfolios that combines stock, bond, and commodity. One important thing we need to consider is that different kinds of investors will have different requirements for portfolios. Therefore, the “proper” allocation strategy could be different for different investors.
Aggressive investors attempt to maximize the returns by taking a relatively higher degree of risk. Then long-term Black-Litterman portfolio and Genetic Algorithm would be the proper strategies for them because of their high mean returns. Conservative investors seek to preserve an investment portfolio’s value by investing in lower risk assets. Then Robust Optimization portfolios and long-only Gradient Descent portfolios would be the proper strategies for them because of their low standard deviations of returns. Risk neutral is a mindset where an investor is indifferent to risk when making an investment decision. The risk-neutral investor places himself in the middle of the risk spectrum, represented by risk-seeking investors at one end and risk-averse investors at the other. Therefore, Robust Optimization portfolios and long-term Black-Litterman portfolios would be the proper strategies for them because of their high Sharpe ratio.
The evolution of portfolio allocation strategies brings us better and better approaches to construct portfolios. Besides only considering the allocation strategies, we need also have a better estimation of future returns just like the Long Short-Term Memory approach we tried to forecast the future prices. To get even better performance, we need to keep researching and make a better combination of the two parts.