Authors:
- Akhil Dappalapudi
- Mohamed Aziz Larabi
- Pankaj Sontakke
Supervisors:
- Dr. Ionut Florescu
- Dr. Papa Momar Ndiaye
Abstract
In current credit ratings models, various low frequency information is usually selected as prediction variables to predict the ratings by rating agencies. The proposed study involves accounting, equity, and bond data on a monthly rate. In addition to these accounting and market based information, complex features such as the distance to default, the distance to capital, and the credit spreads are used as predictors. Using machine learning techniques, two credit rating models are presented in this research. The first predicts implied credit ratings of the issuer, while the second estimates the credit rating issuer compared to its peers. The study is essentially focused on the banking sector from 2011 until 2018.
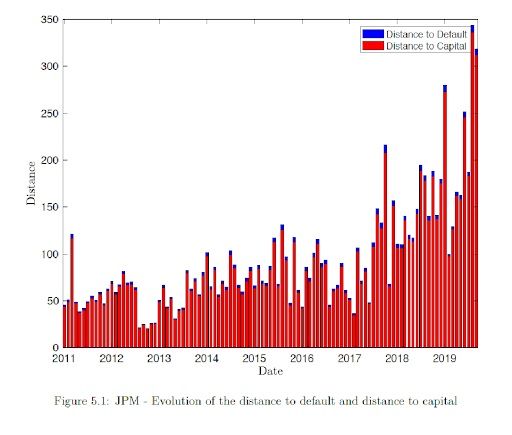
Distance to capital in the above graph shows that after the financial crisis the JP Morgan has been improving its financial health and from 2017 the distance to capital is much larger than previous years which implies that JP Morgan has more asset compared to debt. From the Figure 5.1 we observe high correlation between distance to default and distance to capital. In addition, it is essential to mention that the distance to capital is lower than the distance to default as it considers regulatory intervention for financial organizations. So more risk information is taken into account by the distance to capital.
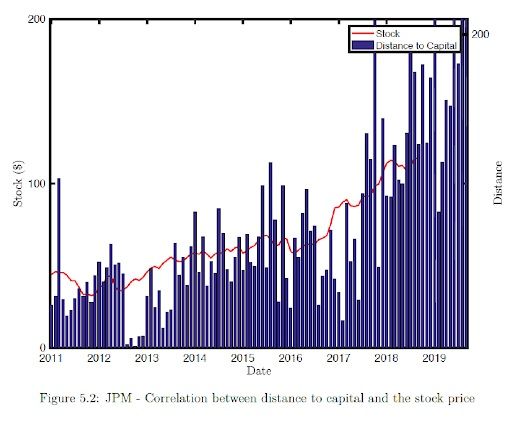
Correlation between Stock Price and Distance to Capital is 0.7. Since the distance to capital predicts one year in the future we could use this correlation to make equity investment decision. After observing the distance to default for the upcoming months there is a strong indication that the stock price would maintain its current growth and could be a buy signal.
Feature Selection
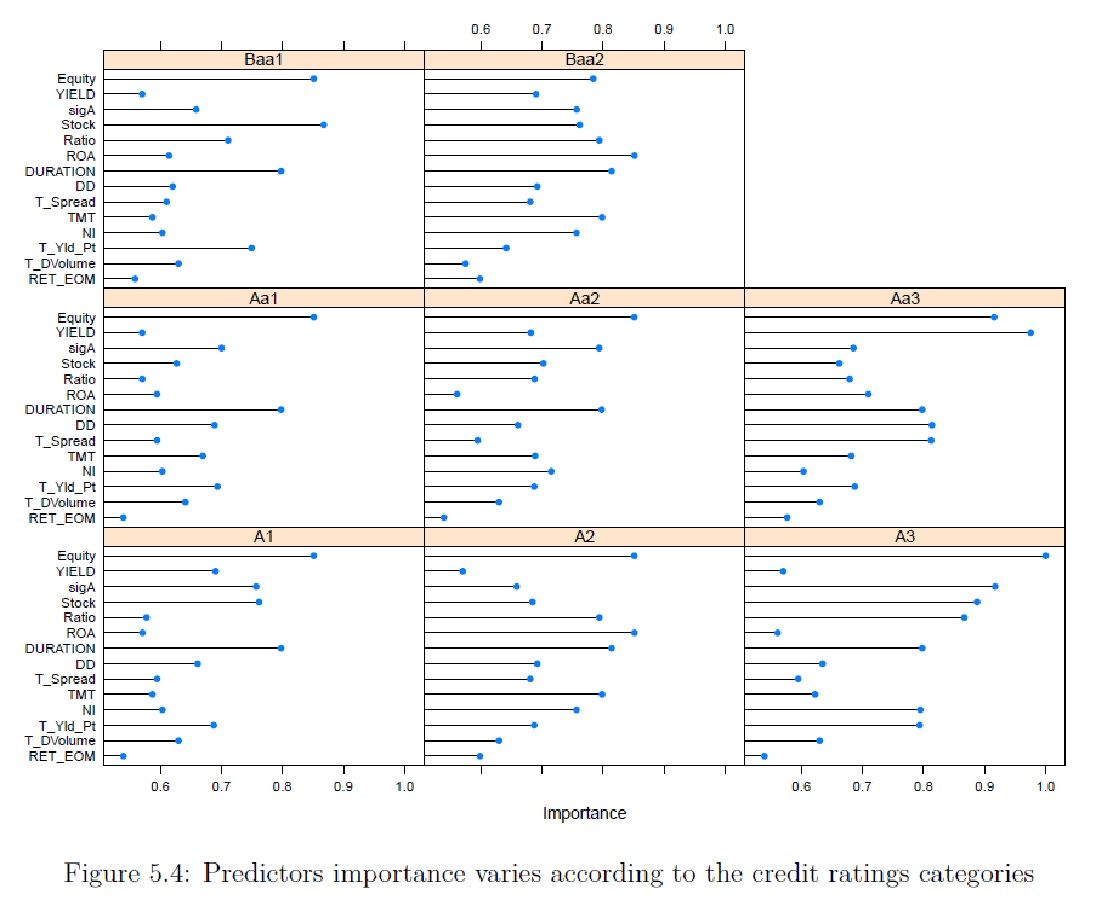
From the Table 5.4 above, we observe that the predictor importance varies according to the different categories of ratings. This means that the feature selection is proper to every single company we would like to rate. Indeed, we cannot first select the features and then run the models based on this predictors set for all kind of companies. It is essential to differentiate the features selection according to the company credit category.
Prediction
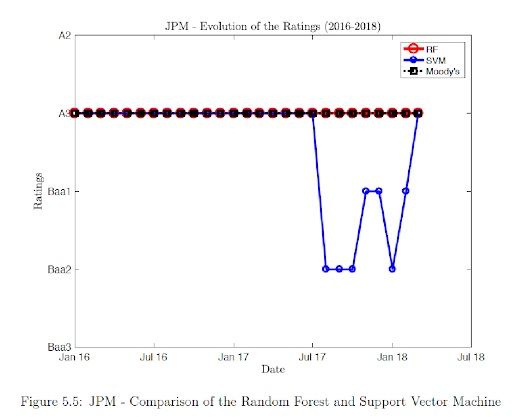
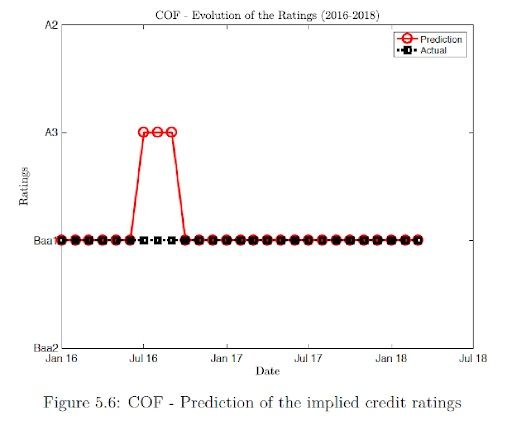
The results show that Random forest agrees with the actual rating whereas SVM shows more deviation compared to the actual results. Validation shows that Random forest has 100% accuracy compared SVM, which has 74% accuracy. Since random forest has higher accuracy compared to SVM, we use random forest for our different model prediction. The results show that for COF, during the mid-2016 there was a brief period where our model predicts an upgrade but after three months the ratings is downgraded to the actual rating and there after the rating agrees with the actual ratings. The prediction accuracy is of 89%.
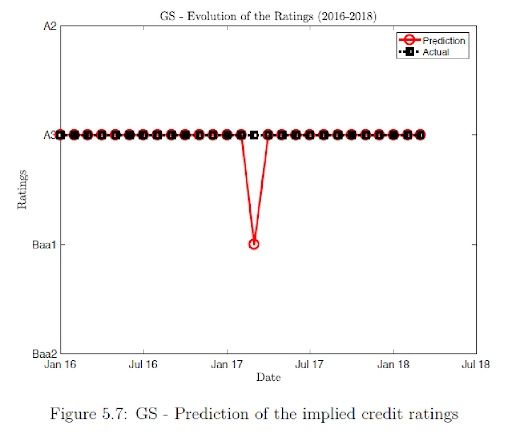
The results show that for GS, during the beginning of 2017 there was a month where our model predicts a downgrade unlike the actual ratings but the model immediately shows an upgrade post that and continues to agree with the actual ratings. The prediction accuracy is of 96%.
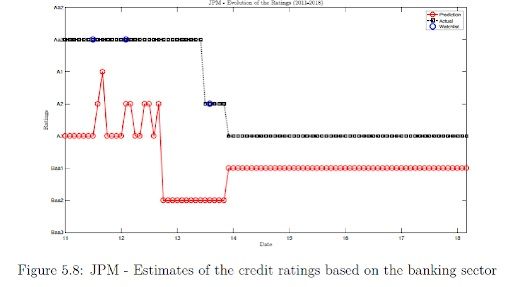
The results show that for JPM, Model 2 predicts that JPM has been overvalued by three levels than the actual rating by Moody’s. There was a negative watch list placed on JPM and eventually the rating for JPM has been downgraded to A3 whereas our model predicts the rating to be still overvalued by one level.
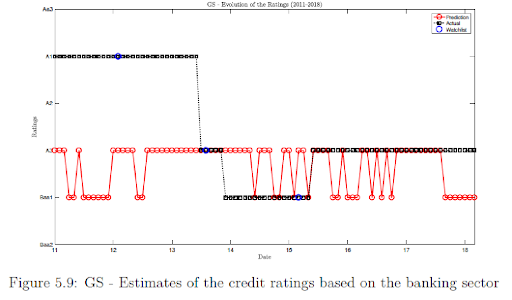
The results show that for GS, Model 2 predicts that GS has been overvalued by two levels compared to the actual ratings by Moody’s. In the mid-2013 we visualize a downgrade to the rating predicted by the Model 2. In addition, after 2013 the actual and predicted ratings have been fluctuating between A3 and Baa1.
Conclusion
We conclude that the KMV-Merton model can be a useful default forecaster on a short term,
but it is not a sufficient statistic for credit ratings. Using bond, equity, and accounting data features along-with distance to default and distance to capital help us build a robust model for credit rating prediction. The features selected, to a significant extent, reflect factors used by rating agencies. We acknowledge that our implementation of the KMV-Merton model is different from that of Moody’s KMV, and therefore the predictions of the Moody’s KMV might be better than those tested in this paper.
Finally, the paper has also discussed how we estimate and evaluate the credit ratings for companies, which would enhance market surveillance work, as they are basic ingredients for credit risk modeling and stress testing financial systems.
We can summarize our findings as follows,
- Random forest models better than Support vector machine, for our dataset, as it shows a higher accuracy.
- Model 1 predicts with a higher accuracy for unchanged ratings
- Model 2 provides a good measure to evaluate the credit ratings for a company, based on its peers.