Abstract
Cryptocurrency, a digital asset designed to work as a medium of exchange, has attracted world-wide attention. Among them, Bitcoin is the most representative and widely use one, representing about 54% of the total market capitalization at present. Given its increasingly popularity in financial trading market, this paper investigates some statistical properties as well as the volatility process of Bitcoin return, provides a practicable machine learning model to predict price movement and attempts to create cryptocurrency ETFs.
Authors:
- FU XIONG
- NAN XUE
- ZIHONG XU
Supervisor:
- Dr. Steve Y. Yang
Keywords: Bitcoin; M1 supply; Volatility model; LSTM model; Trading strategies; ETFs
Macroscopic Views
Our original idea was collecting the M1 supply of G20 to perform a cointegration test. In order to do cointegration analysis, it is necessary to do ADF test first.

We performed Engle-Granger two-step cointegration test to see if there exists a cointegrating relationship. The p-value is 0.4055, which means there is no cointegration. Thus, there is no long-term underlying relationship between Bitcoin capitalization and M1 supply.
Volatility process
In the paper we reviewed, different kinds of GARCH model had been used, such as GJR-GARCH, GARCH(1, 1) and EGARCH(1, 1). But previous work did not try to compare different volatility models to find the best one. Thus, our next step is fitting different GARCH models on Bitcoin return series and finding the model that has the best explanatory ability.

We can see that both student-t distribution and generalized error distribution can significantly improve the explanatory ability of GARCH model. Among the models we used, EGARCH model with generalized error distribution provides the best fitness.

The main reason is that when the window moves on, those models are not significant or cannot pass the statistical tests in some periods. The results show that EGARCH-GED model can provide the best evaluation. It is also the best model we found that could explain the volatility process of Bitcoin return.
Prediction of Bitcoin price
In this section, we build up 4 different kinds of predicted models, such as Linear regression, Ridge regression, SVM and Long Short-Term Memory model, to predict Bitcoin price movement and then select the model with the best performance to build up a trading strategy in Bitcoin market.
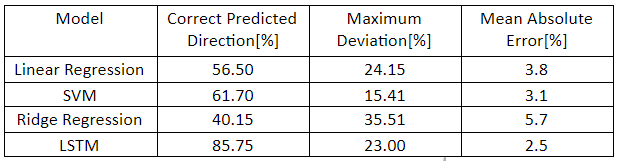
From the Predicted performance table above, we can find that the Long short-term memory model has the best correct predicted direction and the value is 85.75%. The maximum deviation of LSTM is 23.00%, which is relatively high for prediction. However, we must notice the range of testing set is more than one year, which will make prediction more difficult. In addition, the LSTM model has the lowest mean absolute error in all predicted models.
We use the model to create an easy strategy for Bitcoin market. For the trading signals, if the predicted value is negative, the signal will be set up -1. If the predicted value is positive, the signal will be set up +1.

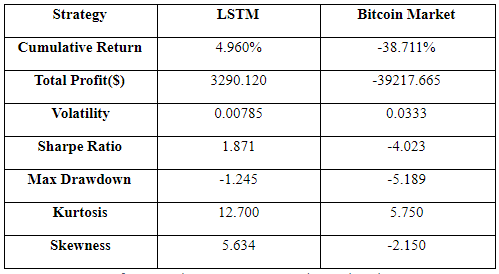
Our trading strategy performed lower volatility and max drawdown but higher Sharpe ratio and kurtosis than Bitcoin market. It actually proves that our trading strategy may earn profit in the Bitcoin market, but we still need more data to test our trading strategy.
Creating ETFs
We chose 10 cryptocurrencies to build ETFs. All of 10 cryptocurrencies have higher market capitalization which is larger than 1 billion dollars, which can represent crypto market effectively. In addition, the correlation of them are range from -0.07 to 0.59, which are small enough to diversify risk.

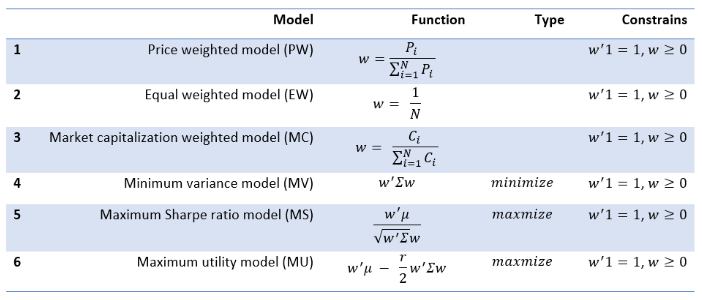
The first three models are traditional weighted index, which are applied by The Dow Jones Industrial Average (DJIA) and S&P 500 Index. The other three are based on portfolio theory.

By calculating the statistical measures of all the models, it is found that minimum volatility model got the lowest standard deviation while maximum utility model also got lower volatility which is just a little bit bigger than that of minimum volatility model. For the skewness, all the models have negative skewness except maximum utility which means that the model has higher probability to get extremely high return and lower probability to get extremely low return. By considering Sharpe ratio, it is certain for maximum Sharpe ratio to get higher Sharpe ratio, but maximum utility one also gets the higher Sharpe ratio which is just a little bit lower than that of max Sharpe ratio model. For the value at risk, max utility model also performs well.
Conclusion
According to our study, there is no statistical long-term relationship between Bitcoin and the money supply. Besides, Bitcoin returns have nearly no correlations with other traditional assets, which provides opportunities for the risk management of portfolios. The volatility process of Bitcoin return is also different from that of the other. And EGARCH-GED is the best model for fitness and prediction.
With regard to the prediction of price, LSTM model is the best, which has 85.75% accuracy in the testing set. Because of the dropout function and feature selection, we reduce the over-fitting problem with decreasing a little accuracy. Based on LSTM mode we built a trading strategy using the data of October and November in 2018. The cumulative return of our strategy is 4.96% and beats the market. That may prove the strategy is profitable in the real Bitcoin market. However, we still need more data and tests to prove the profitability, even if the LSTM model had a good performance.
As for ETFs, the short-term maximum utility model performed best with a higher return, Sharpe ratio, lower volatility, lower maximum drawdown, lower value at risk and positive skewness when r is equal to 10.