Abstract
This paper constructs volatility transmission measures based on BEKK GARCH model, extending the spillover framework of (Diebold and Yilmaz, 2012). By applying the new measures to daily and high frequency data, we analyze volatility transmission separately for exchanges that have overlapping and non-overlapping hours of operation. Furthermore, we split volatility transmission effect into self-market, direct-market, and inter-market effect. The major findings show that overlapping markets transmit volatility more intensely with higher data frequency, while nonoverlapping markets see volatility transmission at lower frequencies. Our volatility component analysis reveals that volatility transmission is driven primarily by interaction with other markets or what we call the intermarket effect. By analyzing special events where volatility is known to be transmitted to validate our modle. These empirical results provide a fresh insight into the nature of volatility transmission for policymakers and international investors.
Research Topics:
Volatility transmission, Spillover, BEKK-GARCH
Researchers:
Dan Wang, Phd Candidate in Financial Engineering
Cen Chen, Master in Financial Engineering, Graduated in May. 2018
Xiaotian Lin, Master in Financial Engineering, Graduated in Dec. 2017
Advisor
Main Results:
Volatility transmission in overlapped markets and nonoverlapped markets
Across all sample markets, we observe the magnitude of total volatility transmission for non-overlapping markets has the highest value(0.1728 %) at the daily data, comparing with 0.0366% and 0.0322% in hourly and 15min data. On the contrary, volatility transmission of overlapping markets become higher with the data interval decrease. It is fair to assume that market will be impacted by instant exogenous activity from adjacent markets, but the significant activity happened in oversea market will only fluctuate the other market after news publication overnight. For example, Germany investors absorb the latest news from UK and France shortly, but they may react the information from U.S. market only after the market opening in the next trading day. Thus, investors will put more attentions to the neighboring markets instead of oversea markets, which causes the reversing TVT between overlapping and non-overlapping markets.
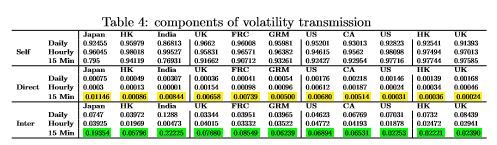
Component analysis of volatility transmission
Table 4 presents the variance of volatility component coefficients with the change of data frequency. We analysis the component of the conditional variance by dividing it into 3 parts, which are Self-market effect, Direct-market effect and Inter-market effect. Unlike other relative studies, we consider about other market effect not only comes from direct-market effect, but also affect by the interacted market effect. For example, when we look at Japan 15 min data, Self-market effect is 93.227%, the Inter-market effect and Direct-market effect are 6.298% and 0.474% respectively. It’s obviously that Self-Market effect is the most significant part of markets’ conditional variance effect, comparing to Inter-market effect and direct market effect. Furthermore, we observe the portions coming from Inter-market effect are all significant greater than corresponding portions coming from Direct-market effect. Take Japan (15 min) as an example, we can notice the value in the green areas (15 min inter-market effect) are all at least ten times greater than yellow areas(15 min direct-market effect). Whats more, we also conducted one-tail T test to see if the difference between Direct and Inter market is significant, and the result indicate that there are strong evidence to reject the null hypothesis (See appendix). Thus, we believe the volatility transmission mainly comes from cross market effect.
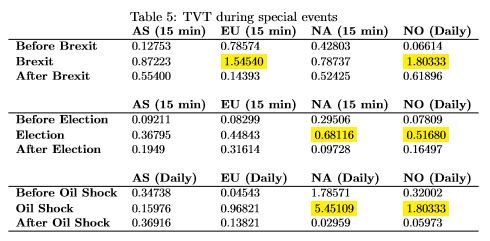
Volatility transmission during Special Event
Conclusions:
There are several contributions in this paper to the understanding of volatility transmission in global markets. The measurement of volatility transmission is based on the generalized spillover framework (Diebold and Yilmaz, 2012), but in contrast to only using volatility spillover, we consider a more comprehensive framework including both volatility spillover and shock effect of volatility. Moreover, to clarify how the volatility transmission is generated, we analyze the components of volatility transmission.
Our major findings imply that volatility transmit more intense in overlapping market with higher data frequency, and vice-versa for non-overlapping markets. In addition, we find inter-market effect significantly dominate on the volatility transmission. Numerical analysis has validate three special events( Oil price crush, Brexit and U.S. presidential election). Our analysis also can help guide some policymakers and investment in the implementation of financial and investment policies.