Abstract
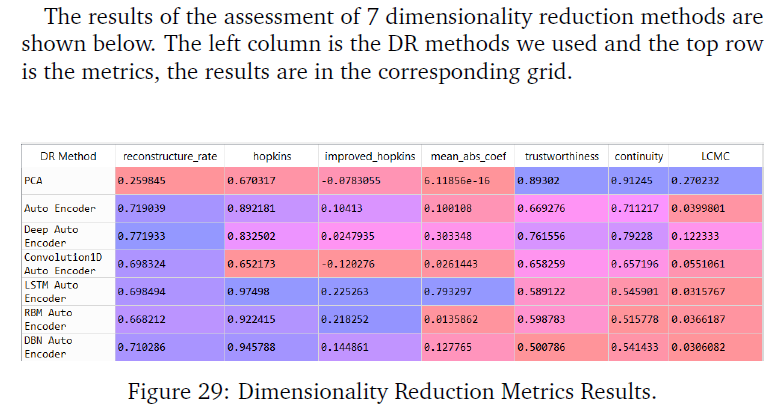
In practice, the existence of daily pattern in volatility of equities is confirmed. The purpose of this report is to implement various machine learning and deep learning methods to recognize SPY, chosen from ETF, intraday volatility pattern based on second-level data. The methods used for data processing include principal component analysis (PCA), Auto-Encoder, Deep Auto-Encoder, One-Dimension Convolutional Auto-Encoder, LSTM Auto-Encoder (Long short-term memory), Restricted Boltzmann Machine (RBM) also Deep Belief Networks (DBNs). Moreover, K-Means and Gaussian mixture model are practiced in order to optimize the clustering result. Last but not least, we compare the performance of the recognition results given different methods we implemented. Evaluation metrics such as reconstructure rate, hopkins and improved hopkins, mean absolute coefficient, trustworthiness& continuity, local continuity meta criteria(LCMC) are used to measure the quality of dimensionality reduction results. Besides, sihouette and calinski score are chosen to evaluate K value selection.
Research Topics:
Volatility Trading Pattern, Principal Component Analysis (PCA), T-Distributed Stochastic Neighbor Embedding (T-SNE), Auto Encoder
Researchers:
Jin Xu, Master in Financial Engineering, Graduated in May. 2018
Yuchen Xie, Master in Financial Engineering, Graduated in May. 2018
Gerui Liu, Master in Financial Engineering, Graduated in May. 2018
Jie Bao, Master in Financial Engineering, Graduated in May. 2018
Advisor: Dr. Khaldoun Khashanah
Main Results:
For the clustering result with PCA, Auto-Encoder and Deep Auto-Encoder, K-Means has less average sample numbers among different clusters than GM. But with the other methods dimensionality reduction methods, we get opposite results. As the complexity of dimension reduction methods increases, samples among different clusters seem to be less average. This is partially because the more complex neural network we use, the more training data is needed in order to get the same confidence level model. Obviously, the last four dimensionality reduction methods were not sufficiently trained. In general, K-Means has greater evaluation score than GM in our evaluation system.
Conclusions:
After analyzing the charts from previous sections, each method has its own advantages and disadvantages from the perspective of optimizing clustering tendency, information loss and neighborhood preserving point of view. For clustering, reconstruction rate and Hopkins statistic are more important, so Deep Auto-encoder gave the best result with both clustering methods. As the complexity of dimension reduction methods increases, our model gives larger optimal K values. Generally, optimized K numbers for K-means and Gaussian Mixture are close, however, K-means gives better Silhouette Score and Calinski-Harabaz Index than Gaussian Mixture Model in general.