Abstract
In this paper, we implement a dynamic discounting framework to measure relative values of U.S corporate bonds. Further, we apply machine learning techniques on bond data and calculated relative values to predict the next period’s option adjusted spreads (OAS). We propose three trading strategies: based on the bond’s relative value, bond’s predicted OAS for the next period, and a hybrid of relative value and predicted OAS strategies. When applied on monthly data of 9,047 bonds between January 2014 and October 2017, all three strategies outperform an equally weighted benchmark on all the bonds. The hybrid strategy generates the highest Sharpe ratio of 2.79 whereas relative value and predicted OAS strategies yield Sharpe ratios of 2.31 and 2.26 respectively.
Research Topics:
Bond, machine learning, relative value, comparable
Researchers:
Dhanoosha Penmetsa
Titus K. Chirchir, Master in Financial Engineering, Graduated in Dec. 2017
Dhanoosha Penmetsa , Master in Financial Engineering, Graduated in Dec. 2017
Advisor
Main Results:
Investment Strategy I
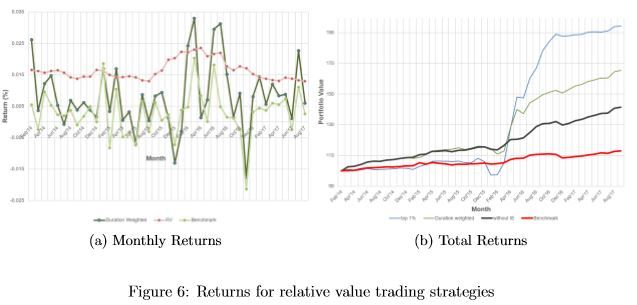
The relative value based strategies were back tested on 4 years of monthly data from January 2014 to October 2017. Figure 6(a) shows the monthly returns of the duration weighted portfolio strategy. The red line plots the average relative value of the bonds that were picked during that month to invest in. Figure 6(b) shows the performance of the total return portfolio constructed from relative value along with the performance of the benchmark portfolio.
Investment Strategies II
Figure 7 shows a comparison of the performance of the three strategies compared to an equally weighted investment on all the bonds. We invest $100 in January 2017 and monitor the portfolio value for each of the strategies. Portfolio value includes the coupon accrued during the vesting period.
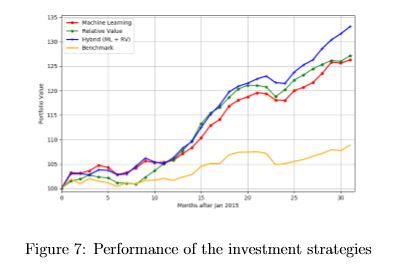
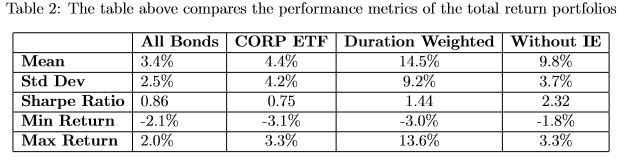
Table 2 summarizes the total return metrics for all three investment strategies and the benchmarks. All the portfolios had a better Sharpe Ratio - a measure risk-adjusted return - compared to both the benchmark portfolios. The duration-weighed strategy excluding the energy sector outperforms the other portfolios on all the metrics. Notably it exhibits the highest Sharpe Ratio. The minimum return which provides information about fat tails is lowest for the portfolio that includes the energy sector and highest for the one divesting from the energy sector. This is a consequence of the high volatility in the energy sector resulting in fat tailed return distribution.
Conclusions:
In this paper we implemented the concept of dynamic discounting of cash flows to value bonds and come up with a measure for relative value. We used the relative value measure obtained to construct portfolios that outperformed their respective benchmarks and market traded ETF on a risk-return basis. In the construction of the portfolio, we considered for duration risk and credit risk by building a duration adjusted portfolio and filtering out bonds with highest probability of default. The different strategies built using the dynamic discounting relative consistently outperformed the benchmark on all considered parameters of risk, return and fat tails. Also, we discussed the shortcomings of the strategy and caveats which should be kept in mind while using the strategy.
n addition, we introduced machine learning techniques to predict bond option adjusted spreads and formulated trading strategies based on our results. Similar to the relative value strategy, the pure machine learning strategy generated better Sharpe ratios than the benchmark. However, the machine learning strategy still under performed the relative value strategy. We were able to show that the two strategies - machine learning and relative value - can be married together to form a hybrid strategy that generates an even higher Sharpe ratio than either of the two pure strategies. Since the hybrid strategy picks bonds that are undervalued and whose spreads are predicted to tighten in the next period, it has more information to make bond-picking decisions. Between January 2015 and October 2017, the hybrid strategy generated annualized returns of 11.16% at a Sharpe ratio of 2.79 whereas the relative value and machine learning strategies yielded returns of 9.06% and 9.03% at Sharpe ratios of 2.31 and 2.26 respectively. An equally weighted portfolio of all bonds generated 3.33% returns at a Sharpe ratio of 0.76.
In conclusion, the results from the model-based approach we discuss suggest that the dynamic discounting, relative value and machine learning strategies can be used separately or together to add value to the process of investing in corporate bonds. The models can provide useful tools for shortlisting bonds for further fundamental analysis before investing.