Introduction
In our study, we wish to investigate the relationship of different liquidity measures with the asset movement direction at the time of a major financial event. We chose the U.S. presidency election in Nov 2016 and hurricane Harvey in Aug 2017 for the reason of its recent relevance and the huge movement during the events.
We will compare our study with the previous research done on BREXIT [10] to see for different financial event, if the significance of each liquidity measure has changed or not.
Research Topics:
Liquidity Risk, Financial events, Asset movement direction, Liquidity Measure
Researchers:
Hongjing Zhang, Master in Financial Engineering, Graduated in Dec 2017
Menglu Jiang, Master in Financial Engineering, Graduated in Dec 2017
Rensheng Wang, Master in Financial Engineering, Graduated in Dec 2017
Advisor
Main Results:
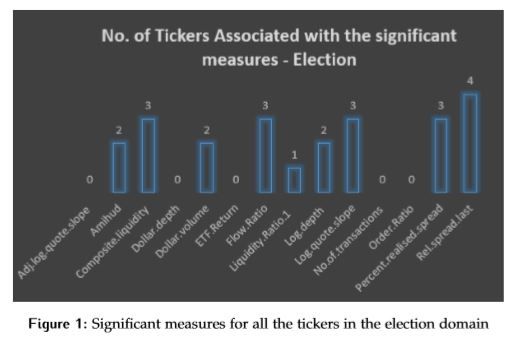
We first access which of the features among the 14 variables are statistcical significantly non-zero using logistic regression for the election dataset. We have made a chart counting the tickers associated with the statistically significant liquidity measure with a p value less than 0.05 (See Figure 1). Relative spread calculated using close price appears to be the one with the highest number of ticker associated with it (4 companies out of 10). This is consistent with the study done on BREXIT [10], which shows that spread-related measures are the ones that are influencing asset return direction the most.
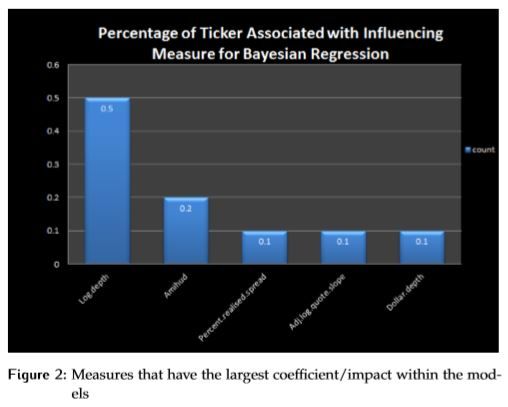
Now we move on to access which of the measures appearing as statistically significant have the largest impact on the direction of asset return. Here we use Bayesian ridge regression done on election data as an example (see Figure 2). We observe that Log depth appears 40% of time being identified as having the largest coefficient across companies within the model. The same result also appears in Ridge Regression. We can conclude here that Log Depth appears to be the most influential factor among the four models (LASSO, RIDGE, BAYESIAN RIDGE and SVM) for the election dataset.
Accuracy Study of Forecasting Direction
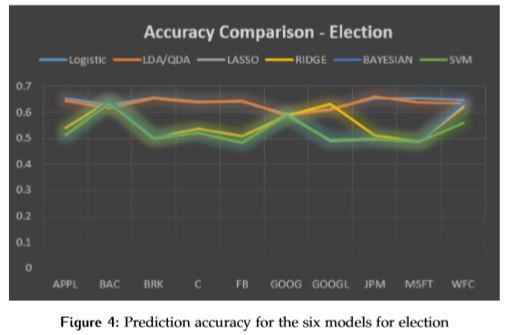
We observe that the accuracy varies by securities during election. Figure 4 is the result for the election dataset. Logistic Regression and LDA have higher prediction accuracy compared to four other models. And they achieve roughly 65% accuracy.
Conclusions:
In this study, we consider 14 liquidity measures to depict market liquidity using high frequency data for the 20 companies in two separate financial events. We implement several different statistical models to access the significance of each liquidity measure on the movement of asset return during the Presidential Election in 2016 and the Hurricane Harvey in 2017.
The results suggest that although the importance of liquidity measures is changing across securities and events, but in general, spread related measures are still the most influencing factors. This is consistent with the study done on BREXIT [10]. And we still have to keep in mind that there are still many other liquidity measures having a significant impact on the direction of asset return direction like log depth, etc. Also we are able to achieve a rather high prediction accuracy for the Presidential Election than Hurricane Harvey, we suspect that this is due to the rather huge scale of the former event over the later.
To serve as future reference, we purpose that one can develop and back-test trading strategies based on the results. Also one can try to shift the response variable (the direction of asset return) by several time steps ahead instead of one. Finally, the effect of these liquidity measures can be studied across markets (e.g. Emerging Market, Foreign Exchange).