Abstract
There are two parts in this project. For the first part, local volatility surface is built using two different approaches, the first method is to calculate the local volatility by using option price, the second method is to calculate local volatility using implied volatility. Then the results from both methods and the comparison implied volatility surface are displayed in R shiny. In addition to the visualization, the offline study of two methods estimate the percentage of error of both methods. For the second part, a Swaption market monitor application is built based on SABR model and R Shiny dashboard. This monitor can offer both market quote volatility surface and SABR volatility surface. A back testing strategy is exercised and the returns and profits are shown in UI. This information can offer traders some trading suggestions.
Research Topics:
SABR Model, Local volatility, Swaption Market Monitor
Researchers:
Research Group (2016 Fall):
Kejia Huang, Master in Financial Engineering, Graduated in May 2017
Libo Duan, Master in Financial Engineering, Graduated in May 2017
Zenghui Liu, Master in Financial Engineering, Graduated in May 2017
Advisor:
Dr. Ionut Florescu
Dr. Dragos Bozdog
Dr. Honglei Zhao
Project Link: Visualization of Volatility Surface and Swaption Market Monitor
Main Results:
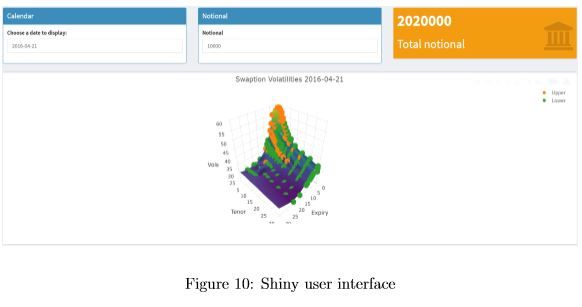
By using shiny dashboard, we build an UI for visualization. First, user can choose a date from calendar and set a notional for one swaption. The application will take these two values as parameters for loading data and calculation. The results will be shown as 2 chart and 2 tables. The first chart contains the SABR volatilities surface and the swaption whose quote volatility excesses the SABR confidence interval as a marker, the orange markers means the volatility excesses the upper bound and the green markers means the volatility excesses the lower bound.
Conclusions:
In the first part, the local volatility surface is estimated with two methods. The analyzation of the performance of these methods show the pricing error for the first method is 5.66% by using Black-Sholes option pricing model, and error for second method is 3.70%. The higher error first method might be cause by using Black-Sholes model to price the option before implement the local volatility definition formula. Second part, in the SABR calibration part above, the results of the swaption whose expiry is small are not very good.The problem is that in the project the initial value is fixed when doing optimization of the objective function. The initial value will have a big effect on the calibration results, so a better methodology for setting initial value will make the results better. The value of beta will also have some effect on the results, in this project we fixed beta, so finding a good method to estimate beta improve the results for SABR model calibration. For the swaption monitor, the results of our strategy need to look into future this is impossible in the real world, since the only input of the SABR volatility formula that we need is forward swap rate, to improve this part we can use other model to predict the forward swap rate.