Researchers:
Ashley Delpeche
Shalini Menon
Zhentao Du
Faculty Advisor:
Zhenyu Cui
Abstract:
This paper explores the relationship between macroeconomic variables and the S&P500 index using statistical methods such as VAR, cointegration, LSTM, and Q-learning. Eleven variables from 2006-2019 were used. The VAR model showed moderate similarity between predicted and actual data, while cointegration and Q-learning exhibited strong positive correlations for long-term forecasting.
Results:
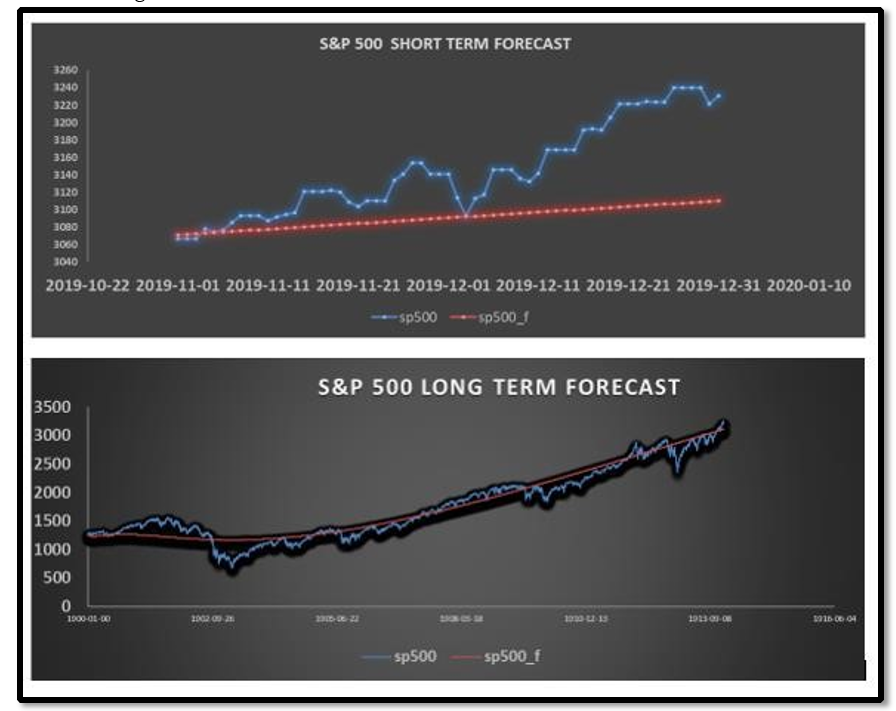
1.Vector Autoregression
Vector Autoregression Forecast of S&P500 and Unemployment. Using VAR estimation values obtained for all 11 variables against original data set. This was use to analyze correlation amongst the original data and VAR output on a short and long term stance
Below are sets of Vector Autoregression correlation analysis of three specific indicators against S&P500.
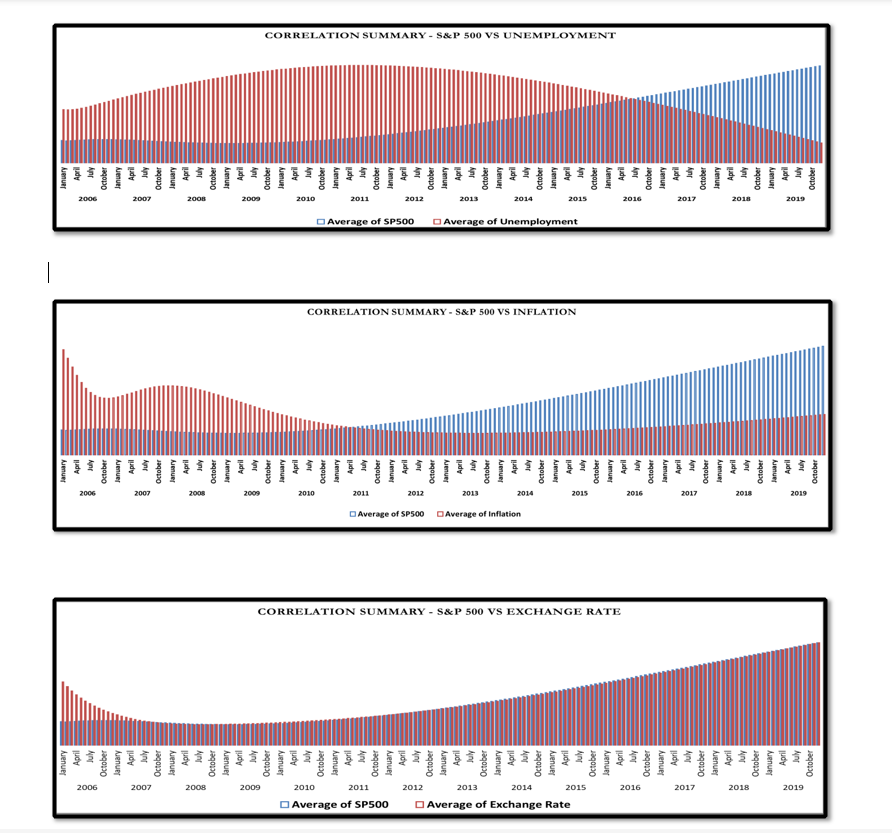
Results display causality and dependence of S&P 500 to Unemployment, Inflation and Exchange Rate which shows various relationship stances amongst the variables.
2. Johensan Cointegration
The output components from all trace tests were used to forecast the S&P500, and three different predictions were made.
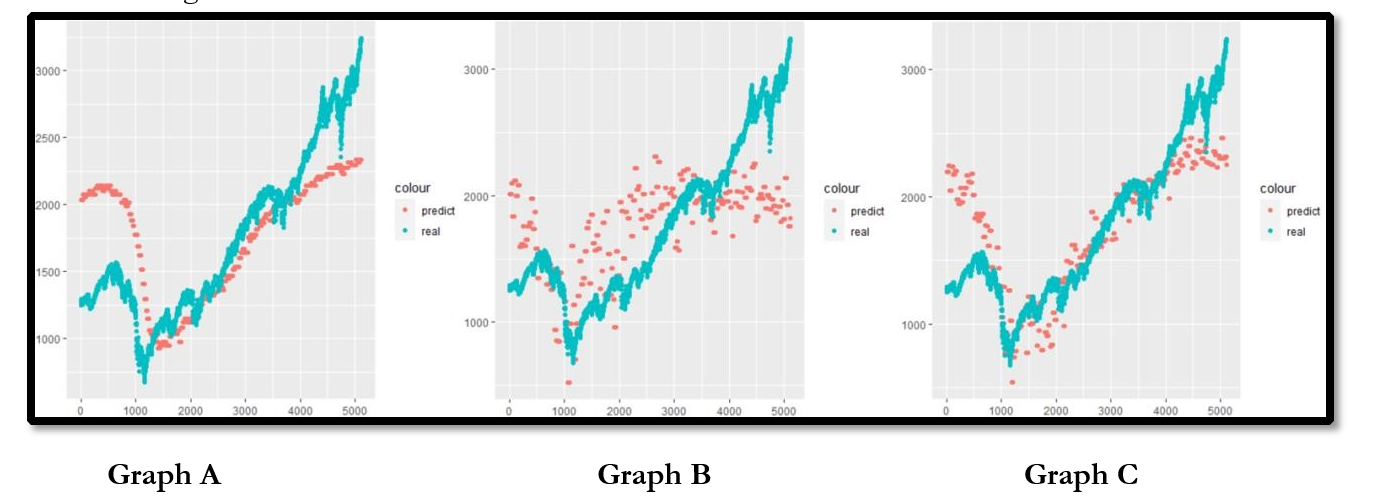
Graph (A) summarizes the results, but they can be rejected at both the 5% and 1% level. The smoothness of the output may result in small signals being ignored. Graph (B) shows results that can be rejected at the 1% level but is better at catching small changes. However, it does not follow the trend very well. Therefore, the best result is shown in graph (C) because all of the result parameters are larger than the critical value, and it shows both small changing signals and long trends.
3. Machine Learning
3.1 Long Short-Term Memory
The LTSM method predicts the 30th value after reading the first 30 values and repeats this process until the last value. The initial results are shown in a figure.
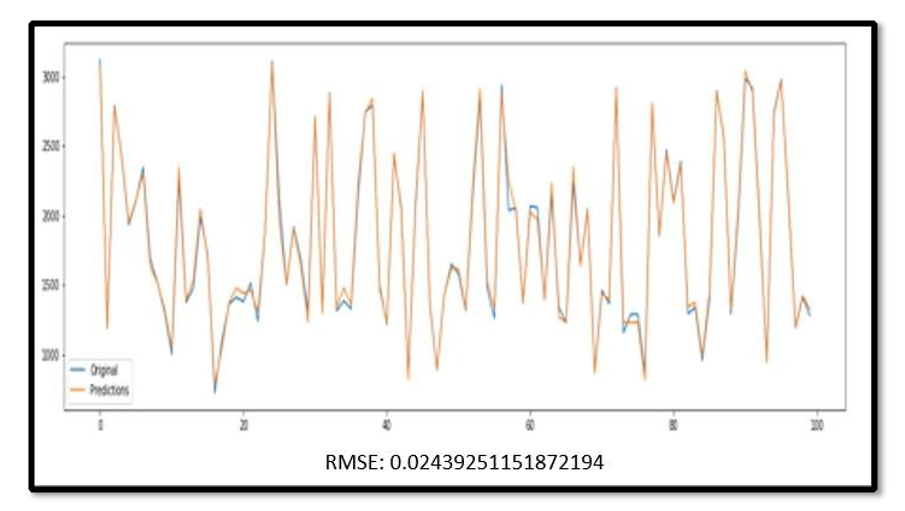
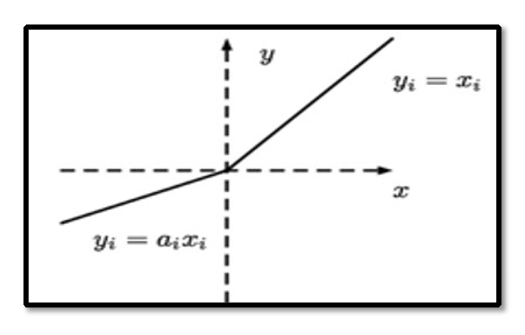
The paper experiments with different model configurations, including varying the number of layers, alpha values, and activation functions (Tan, Sigmoid, ReLU, and Leaky ReLU). We found that Leaky ReLU worked the best, as it helped solve the problem of vanishing gradients by accounting for negative changes. We achieved the best results with a model consisting of four layers, Leaky ReLU activation function, and an alpha value of 0.05.
3.2 Q learning
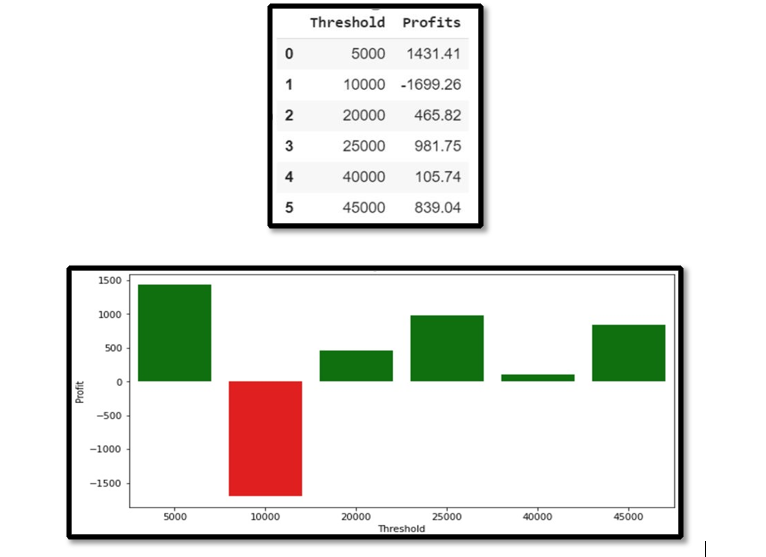
The paper showcases a Q-Learning environment tailored to the stock market, using the S&P 500 as a measure. Gains were rewarded while losses were punished, and we incorporated the trader's risk threshold using Value at Risk (VAR) to ensure trades stayed within acceptable loss limits.
Conclusion:
In this experiment, Machine Learning algorithms were found to provide more accurate stock market predictions compared to statistical approaches such as Vector Autoregression and Johansen Cointegration. Neural networks were able to account for overall trends as well as small fluctuations by taking a multi-dimensional approach. Vector Autoregression was used to analyze individual variable relationships and forecast values. Johansen Cointegration was used to analyze correlation amongst variables and determine leading indicators for stock market prediction. Results showed that S&P 500 had a strong impact on variables such as Unemployment, GDP, Housing, Exchange Rate and Inflation, and that GDP, Housing, Inflation and Exchange Rate could be used as leading indicators for S&P 500 prediction.
Machine Learning algorithms accurately predict stock market trends by understanding nonlinear relationships among macroeconomic variables. Neural network algorithms take all variables into account to make predictions, as shown in the LSTM model with a mean square error of 0.01537. Q-Learning improves with each trade, as seen in positive profits. Factor analysis using PCA identified debt, interest rate, oil prices, GDP, and housing prices as the top 5 variables impacting the stock market.