Researchers:
Veronica Abramson
Gabriel Maiolo
Michael Zit
Faculty Advisor:
Dr Ionut Florescu
Abstract:
This paper investigates the Thomson/Refinitiv (TR) ESG scoring methodology in an effort to understand the transparency and validity of the data that is collected and how it is weighted for various companies within the same sector. Our investigation begins with a deep-dive into the documentation and rating strategy that is provided by TR. This led us to investigate each of the six data sets that are provided by TR, where we discovered a large number of missing raw data values for each company in the data set. We then refined the data to only those companies that are included in the Standard & Poor’s 500 and ran various regressions on the 10 ESG category scores and the raw data variables to analyze their relationship to the overall ESG score. Our findings show that TR is using the exact same weightings of ESG data on companies that have the same business codes and that their ESG scores to variables have the same weighting year over year since 2002. This indicates that the TR ESG score does a poor job of reflecting the current environment or historical environments. This is an important distinction as rapidly-changing sectors, such as technology, have gone through a multitude of changes over the years and this is not being reflected in the scores. This also makes it possible to create a predictive model of future ESG Scores given a company’s raw data variables only if TR is not altering their weights every year.
Results:
Regression Overall ESG Score vs Raw ESG Variables
We wanted to start with looking at the data from a bottom-to-top approach using linear regressions to find the coefficients of the raw variables. We only used the data that was continuous for our regressions and excluded any survey data that provided binary outputs of 1 or 0. We subset the data by ticker and then run a regression of the total ESG score against the 40-50 variables for each of the Environment, Social, and Governance portions of ESG. From this we store the coefficients and the r-squared values to then be analyzed.
Below are some of the regressions and R-squared values of the first couple of tickers in our data. For the Environmental Pillar, not featuring the Societal or Governance pillar.
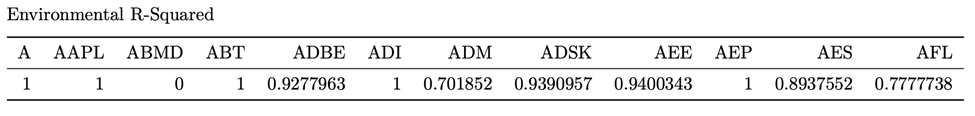
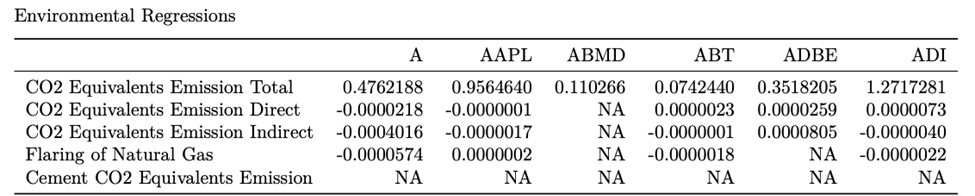
Looking at this data, it is obvious to see that not every company can provide all data points which is to be expected. And in the next layer of the pyramid they aggregate these 620+ data points into a general 180 that are then able to be weighted and distributed into the pillar. That being said, with some Rˆ2 being less than one when regressed onto its respective pillar. One can see that Refinitiv is supplementing the data needed to achieve this score with their own values which are unknown. As they are able to give companies like ABMD which have little to no data scores in each category that have Rˆ2 values of 0 , 0.1828788, and 0.9999948 respective to its E, S and G pillars. How they are able to score such companies with missing data is unknown.
Regression Overall ESG Score vs 10 ESG Category Scores
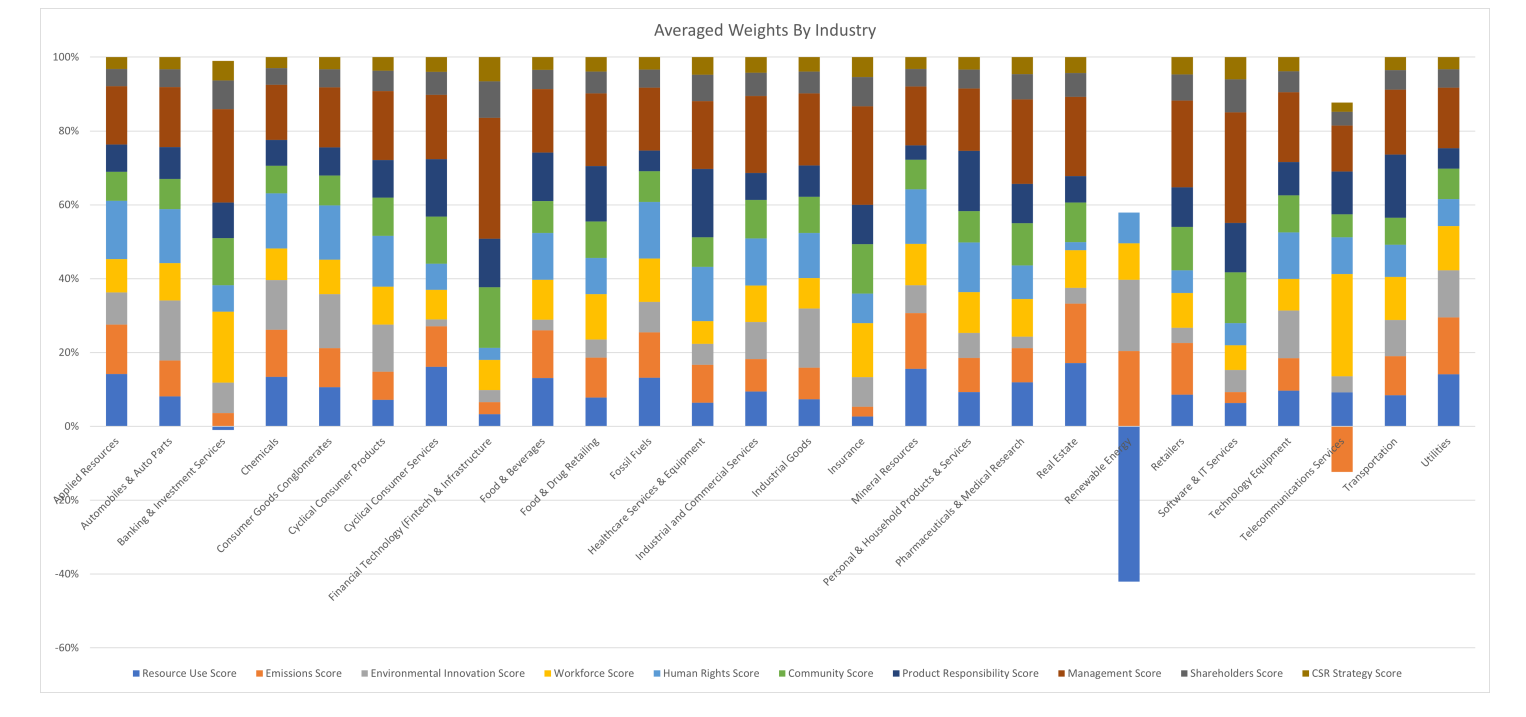
Some examples can be seen, such as the Renewable Energy Sector. In this business sector, there is only one company, but they do not provide enough data in the raw data collection for us to assign a score. Thus their weighting system is show to be totally abnormal. This happens with a few other sector such as Telecommunication who also suffer from related data issues.
Conclusion:
For the individual regressions of the raw variables it appears that Refinitiv weighs certain raw variables as more important depending on a company’s sector/industry. For example, a technology company’s CO2 emissions will weigh less on their Environmental score compared to an energy production company’s score. There are also various raw variables that are still collected but remain inactive which means they are not included in the final calculations that contribute to the total ESG score.
Overall looking at the raw variable data it seems that Refinitiv have not changed the calculation methods of many of the companies since 2002. This is reflected by an r-squared value of 1 or very close to 1 for many of the regressions. This would be very strange since the world and domestic economies have vastly changed as well as the environmental, social, and governance principles in which companies are judged. Therefore, there may be another explanation for the same calculations over the past 20 years. It can also be that when Refinitiv releases new scores with new weights. They then recalculate all the previous year’s scores with the new weights. This would be good for comparison to see how the companies have grown under the same standards however, when not specifically stated can lead to misinformation and misuse of the data.