Researchers: Matthew Montero, Adrian Ramushi, and Zachary Orrico
Introduction
Financial headlines can express views about individual market sectors. This project builds an interactive dashboard to examine how those views affect portfolio allocation, returns, and drawdowns.
Methodology
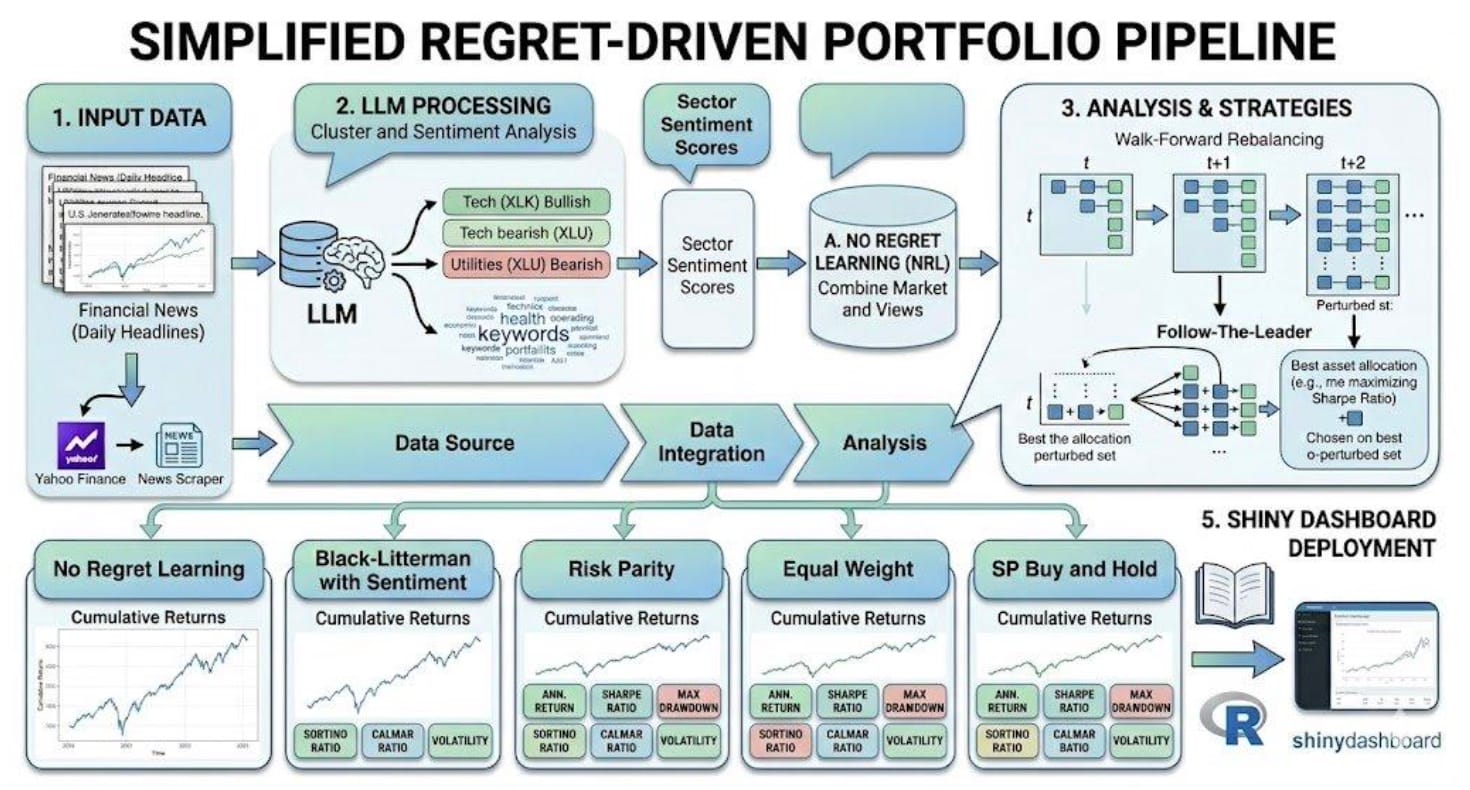
The researchers used a large language model and the Loughran–McDonald financial sentiment dictionary to turn financial news into sector views. The dashboard compares strategies including no-regret learning, Black–Litterman, mean–variance optimization, risk parity, and equal weighting, with SPY buy-and-hold as a benchmark. The evaluation used ten years of daily data across 43 ETFs.
Results & Analysis
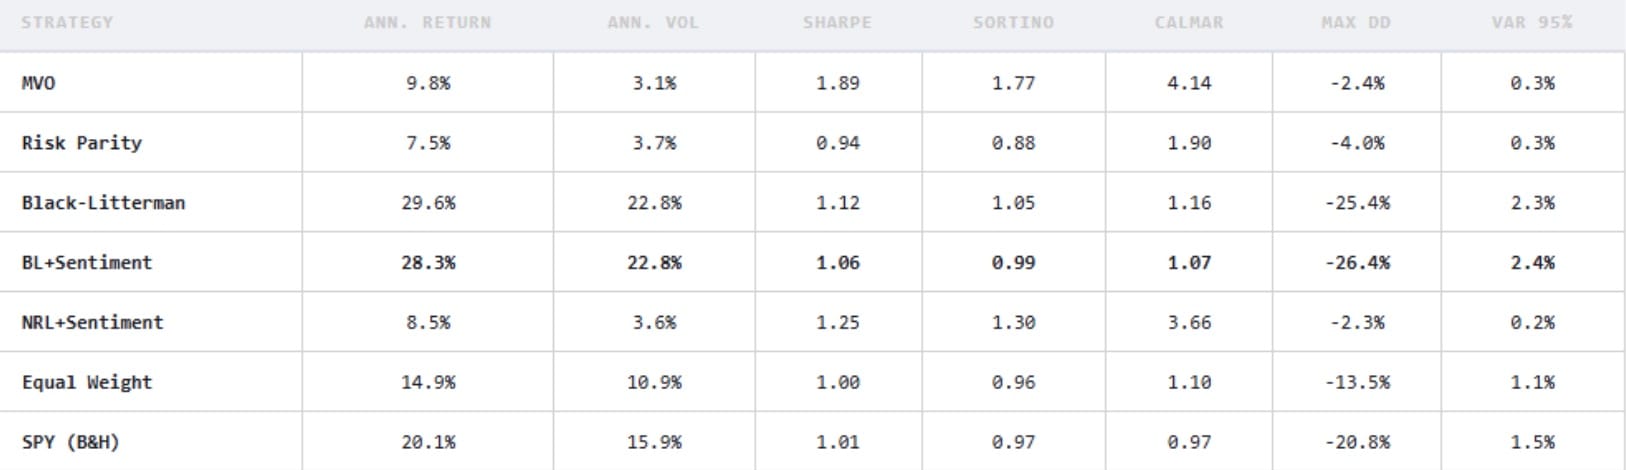
The strategy with the highest annualized return differed from the strategies with the highest Sharpe ratio and smallest drawdown. In the displayed comparison, Black–Litterman had the highest annualized return at 29.6%, mean–variance optimization had the highest Sharpe ratio at 1.89, and no-regret learning with sentiment had the smallest maximum drawdown at 2.3%. Adding sentiment to Black–Litterman lowered its annualized return to 28.3% and its Sharpe ratio from 1.12 to 1.06 in that comparison.
Conclusion
The report finds that strategy performance depends on market conditions and the objective being optimized. The dashboard makes those trade-offs visible by displaying return, volatility, and drawdown side by side.