Researchers:
Jake Vick
Faculty Advisor:
Dr. Ionut Florescu
Abstract:
This research paper investigates whether sentiment in forward-looking text documents, such as the Beige Book, can be a significant metric in a predictive bank risk model. The study collected Beige Book text data from early 2000 to 2020 and used the FinBERT model to conduct sentiment scoring. Seven models were tested, and the results showed that sentiment scores were a significant predictor, and models that included sentiment fit the data better than those without sentiment. The paper concludes that adding real-time data, specifically sentiment, can yield slightly better model fits compared to models without sentiment. The introduction discusses the importance of bank stability and the potential economic effects of bank failures. The paper highlights the need for real-time data for bank examiners and proposes using supplementary data, such as the Beige Book, to identify risks promptly.
Methodology:
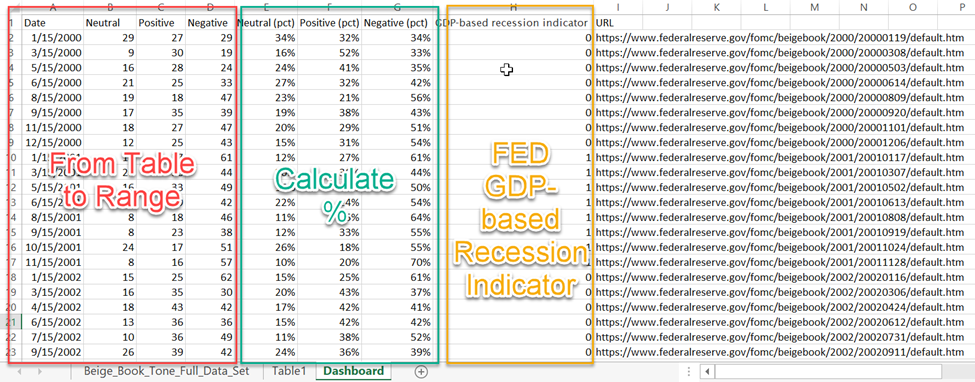
The paper used the FinBERT model, trained on corporate reports, earnings call transcripts, and analyst reports, to analyze the relationship between financial ratios of publicly traded banks and sentiment scores derived from the Beige Book. The study collected financial data from 22 banks using ratios from the CAMELS rating system and other economic indicators such as GDP-based recession indicator, unemployment rate, and consumer price index. The text data from the Beige Book was scraped using Python's Request & Beautiful Soup, and the FinBERT model was used to calculate sentiment scores for each sentence. The scores were then stored in a dataframe for further analysis.
Texas ratio was identified as the dependent variable, a way to measure asset deterioration, and selected one key ratio from each of the six factors of the CAMELS rating system as independent variables. The selected ratios were Tier 1 Capital, Loan Loss Reserve Ratio, Efficiency Ratio, Net Noncore Funding Dependence Ratio, Long Term Asset Percent, and other economic indicators. The research used a linear regression model to analyze the relationship between sentiment scores and the selected independent variables.
Results:
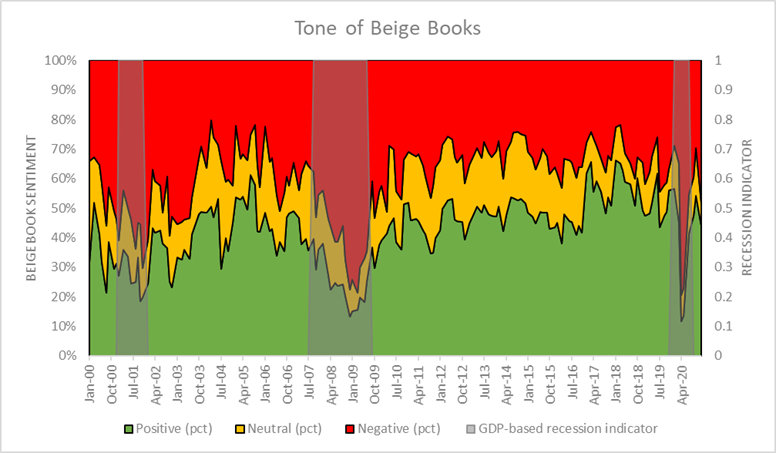
Data was plotted to visualize the results of the FinBERT model. The green area represents positive sentiment sentences, the red is negative, yellow is neutral, and the gray bars on the chart are GDP based recession indicators. The key takeaway from the chart is the positive sentiment increase dramatically near the end of a recession.
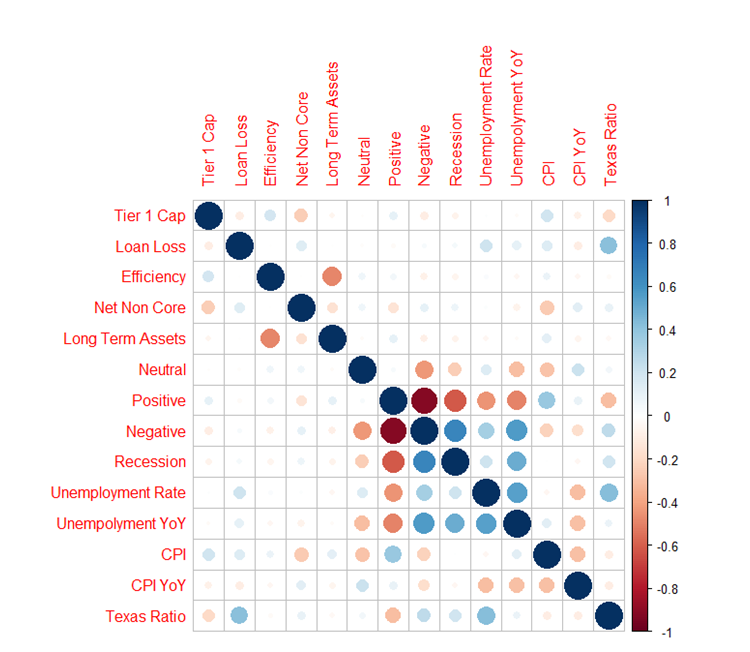
Exploratory data analysis was conducted to identify the most promising relationship between the dependent variable (Texas Ratio) and the independent variables. The analysis showed that Percent of Positive Sentiment had an inverse correlation with Net Non-Core, Recession, unemployment, and Texas Ratio, while it was positively correlated with CPI and Tier 1 Capital ratio. A linear model with significant predictors only was created and tested against other models. The linear model was not the best fit for the data, but removing sentiment scores decreased the overall accuracy, and the sentiment scores were found to be significant variables in the model.
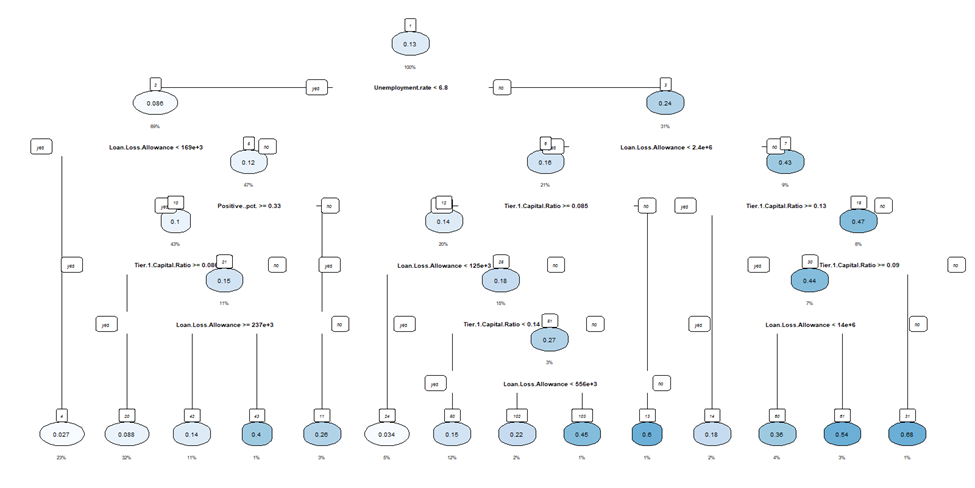
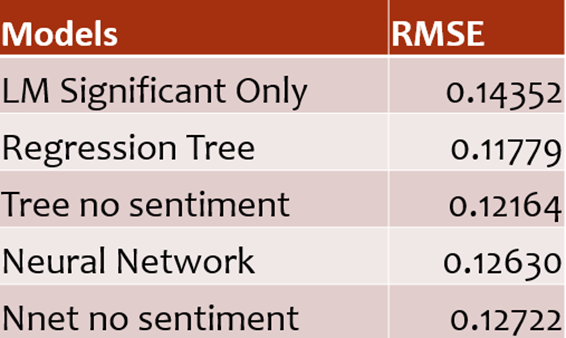
Now with a baseline model identified, two additional models, Regression Tree and Neural Network, were tested and compared to the baseline model. Root Mean Squared Error (RMSE) was selected to compare the models, and sentiment seemed to not have a significant impact on predictability for the neural network model. All of the models tested had a better fit for the data compared to the linear model with significant predictors only. The regression tree was found to be the best model, and the baskets of the regression tree tested were identified. The darker circles at the bottom of the tree are the predictions for the Texas Ratio, with darker colors indicating a higher likelihood of failure.
Overall, it was found that the sentiment scores are important variables to consider when creating a predictive model for the Texas Ratio. The linear model with significant predictors only provided a good baseline, but more complex models like the Regression Tree and Neural Network performed better. The study also highlights the importance of exploratory data analysis to better understand the relationship between variables and improve the accuracy of the predictive model.
Conclusion:
It can be concluded that adding sentiment scores from the Beige Book only slightly improves the predictive power of the model, but the scores were significant variables in all models tested. The regression tree model had the best results and also provided what-if analysis. The results could be presented in a dashboard setting with risk thresholding calculated using the baskets from the tree. Adding in sentiment scores from 10-K and 10-Q filings, analyst reports, and earning call transcripts could yield interesting results. Additionally, improving the CAMELS key ratios used by testing and possibly removing some metrics could be future areas of study.