Researchers: Swapnil Pant and Swara Dave
Faculty Advisor: Dr. Ionut Florescu
Introduction
Markets shift between periods of stability and stress. RegimeSense tests whether a portfolio can respond to those changes by adjusting its allocation when a model detects a different market regime. The project compares the resulting strategy with SPY buy and hold and a traditional 60/40 portfolio.
Methodology
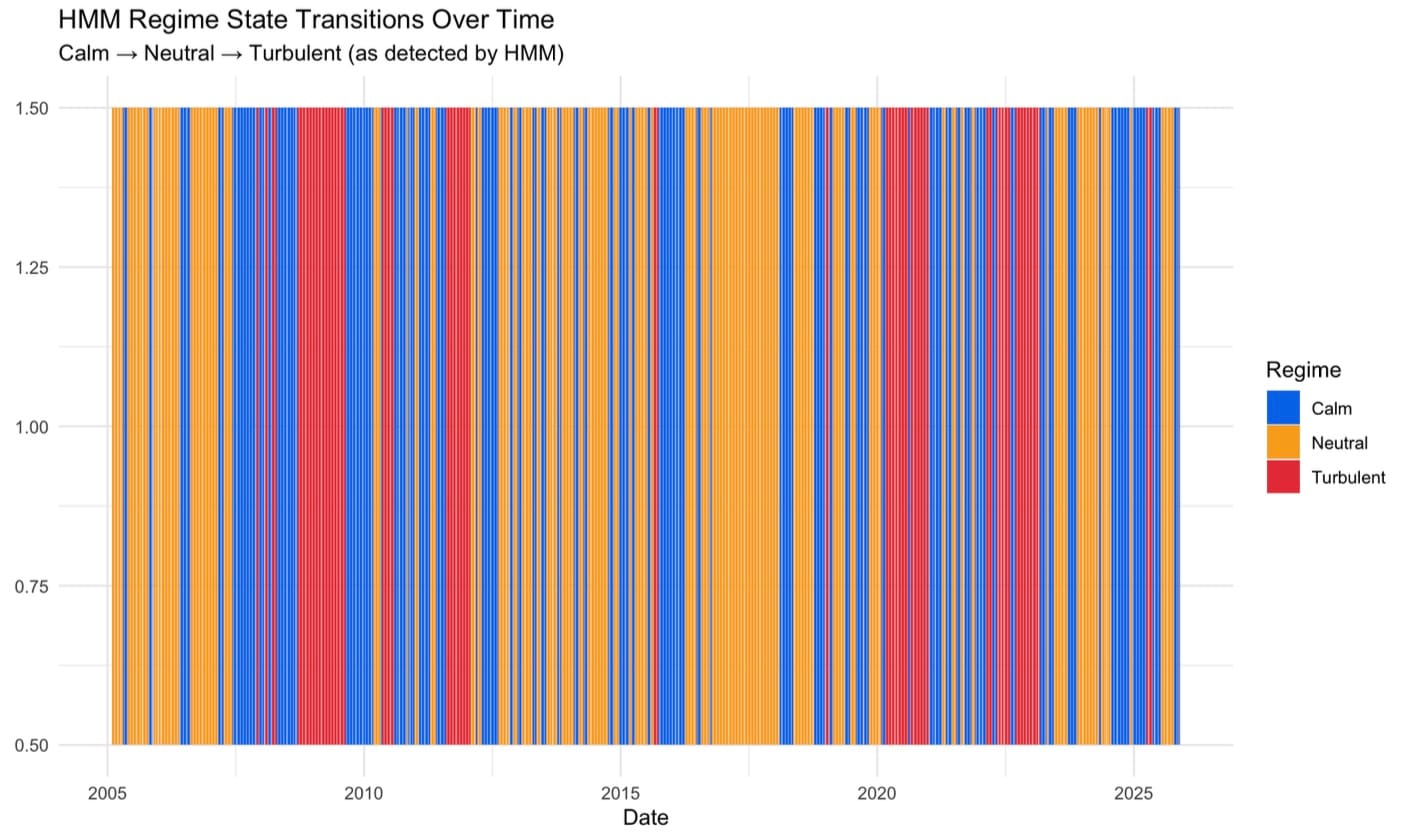
The researchers used a hidden Markov model (HMM) to infer three market states from financial features. They labeled the states calm, neutral, and turbulent, then used the classifications to inform portfolio allocation. The strategy comparison focuses on annual return, annual volatility, and maximum drawdown.
Figure 5.1 shows when the classifications changed. Longer bands indicate that the model stayed in the same state, while densely alternating bands indicate more frequent switches. Red bands cluster around some periods of stress, including the financial crisis. The timeline shows the model’s inferred states, which are the inputs to the allocation strategy.
Results & Analysis
RegimeSense had a smaller maximum drawdown than SPY, but a larger one than the 60/40 portfolio. Its maximum drawdown was 34.6%, compared with 55.2% for SPY and 31.6% for 60/40. RegimeSense returned 8.6% annually, close to 60/40’s 8.5% and below SPY’s 12.1%. Its annual volatility was 12.1%, compared with 11.0% for 60/40 and 19.1% for SPY. The comparison shows how differently the strategy looks depending on which benchmark is used.

Conclusion
RegimeSense reduced downside relative to an all-equity benchmark in the reported comparison. Against 60/40, the strategy’s 0.1 percentage point annual return advantage came with higher volatility and a deeper drawdown. Both benchmarks help show what the dynamic allocation achieved and what it cost in risk.