Researchers: Anit Pradhan, Jesse Goodman, Julia Kelly,
Saugat Shrestha, and Seniya Liyanagunawardana
Faculty Advisor: Dr. Zhenyu Cui
Introduction
A portfolio allocation that works in a rising market can behave very differently during a sustained downturn. This project examines whether identifying market regimes can improve how portfolios respond to changes in risk, including periods of stress and the recoveries that follow.
Methodology
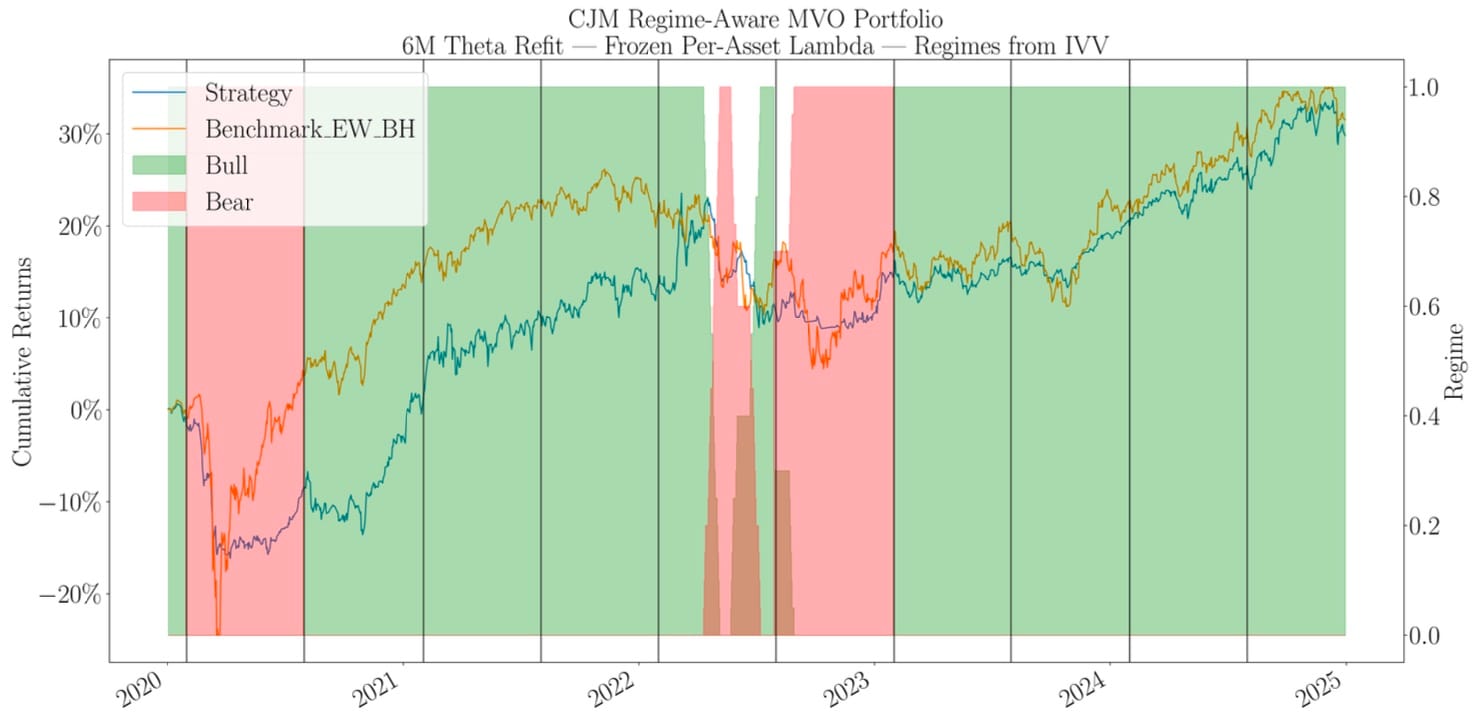
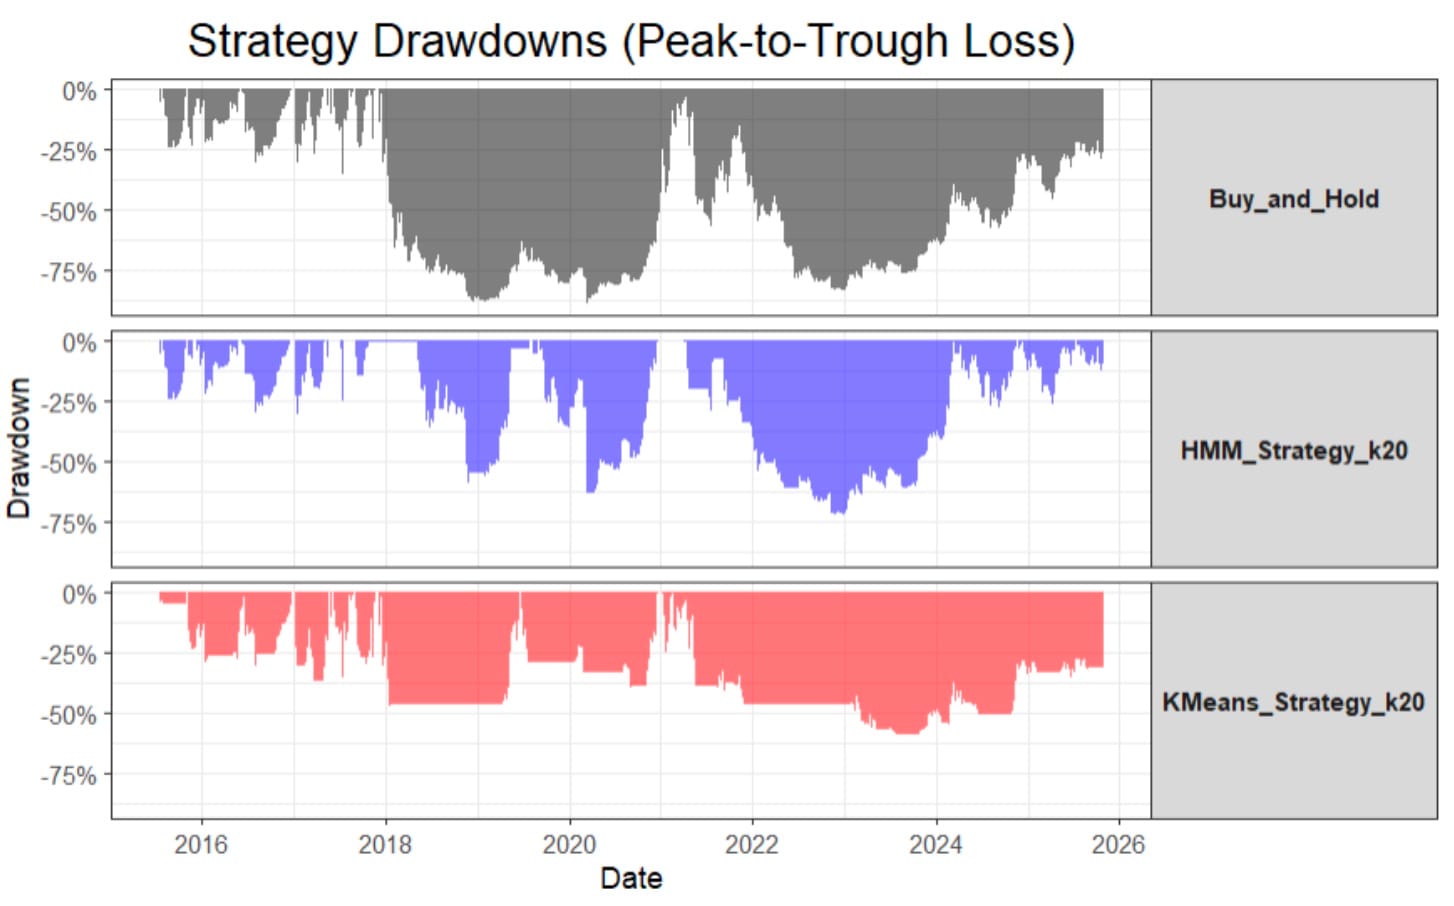
The team explored five modeling approaches for identifying or forecasting market regimes and incorporating those signals into portfolio decisions. The figures below show two experiments. The first combines regimes from a continuous jump model with mean–variance optimization. The second compares hidden Markov model (HMM) and K-means strategies with buy and hold on peak-to-trough losses.
Results & Analysis
In Figure 18, the blue line is the regime-aware portfolio and the orange line is the equal-weight buy-and-hold benchmark. The strategy shifted toward more stable assets before the benchmark reached its low in two of the three bear regimes discussed in the report. It was also slower to move back into recovering assets. The 2020 episode makes that trade-off visible in the two return paths.
In the separate drawdown experiment, the K-means strategy’s maximum drawdown was about 59%, compared with about 89% for buy and hold. The HMM strategy also reduced the deepest loss relative to buy and hold, but its drawdown was deeper than K-means in the period shown. The three panels compare the severity and duration of losses from each strategy’s own prior peak.
Conclusion
Regime information helped limit downside in the illustrated tests. The timing of allocation changes also mattered, particularly when markets rebounded. Evaluating both drawdown and recovery helps show whether a regime-aware strategy fits the portfolio’s objective.