Researcher: Ke Ren
Faculty Advisor: Dr. Zhenyu Cui
Introduction
Market crashes are rare, which makes an early-warning model difficult to evaluate. This project asks whether U.S. equity market data can identify periods of rising vulnerability before a sharp decline. It compares models that infer a high-risk market state with classifiers that score the likelihood of a crash event.
Methodology
The study used daily data from 1993 to 2025 and evaluated discrete and continuous jump models, logistic regression, and gradient-boosted trees. A walk-forward design trained models on earlier observations and evaluated them on later data. This comparison tested how well signals carried forward as market conditions changed.
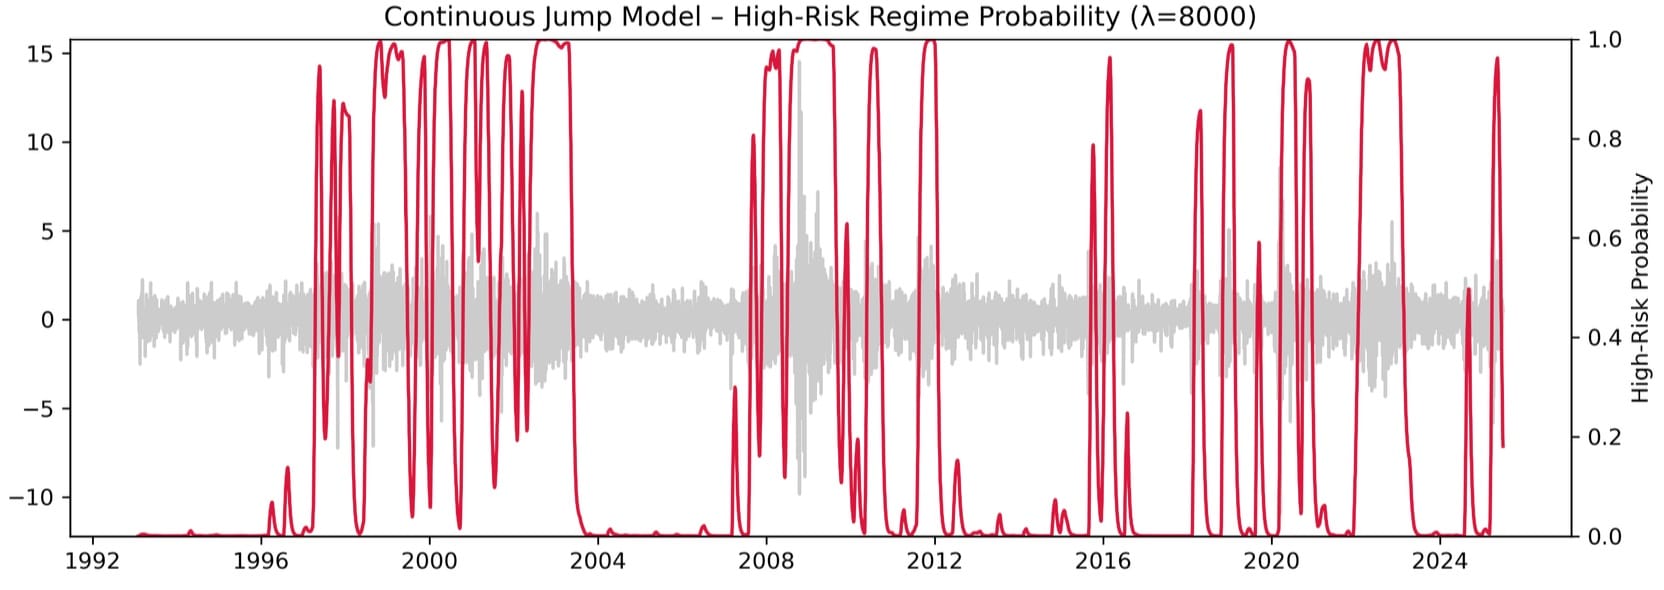
In Figure 4, the red line is the continuous jump model’s estimated probability of a high-risk regime. The probability stays elevated for stretches around some episodes, including the financial crisis, and spikes briefly around others. The distinction helps readers see which signals reflect sustained stress and which are short-lived.
Results & Analysis
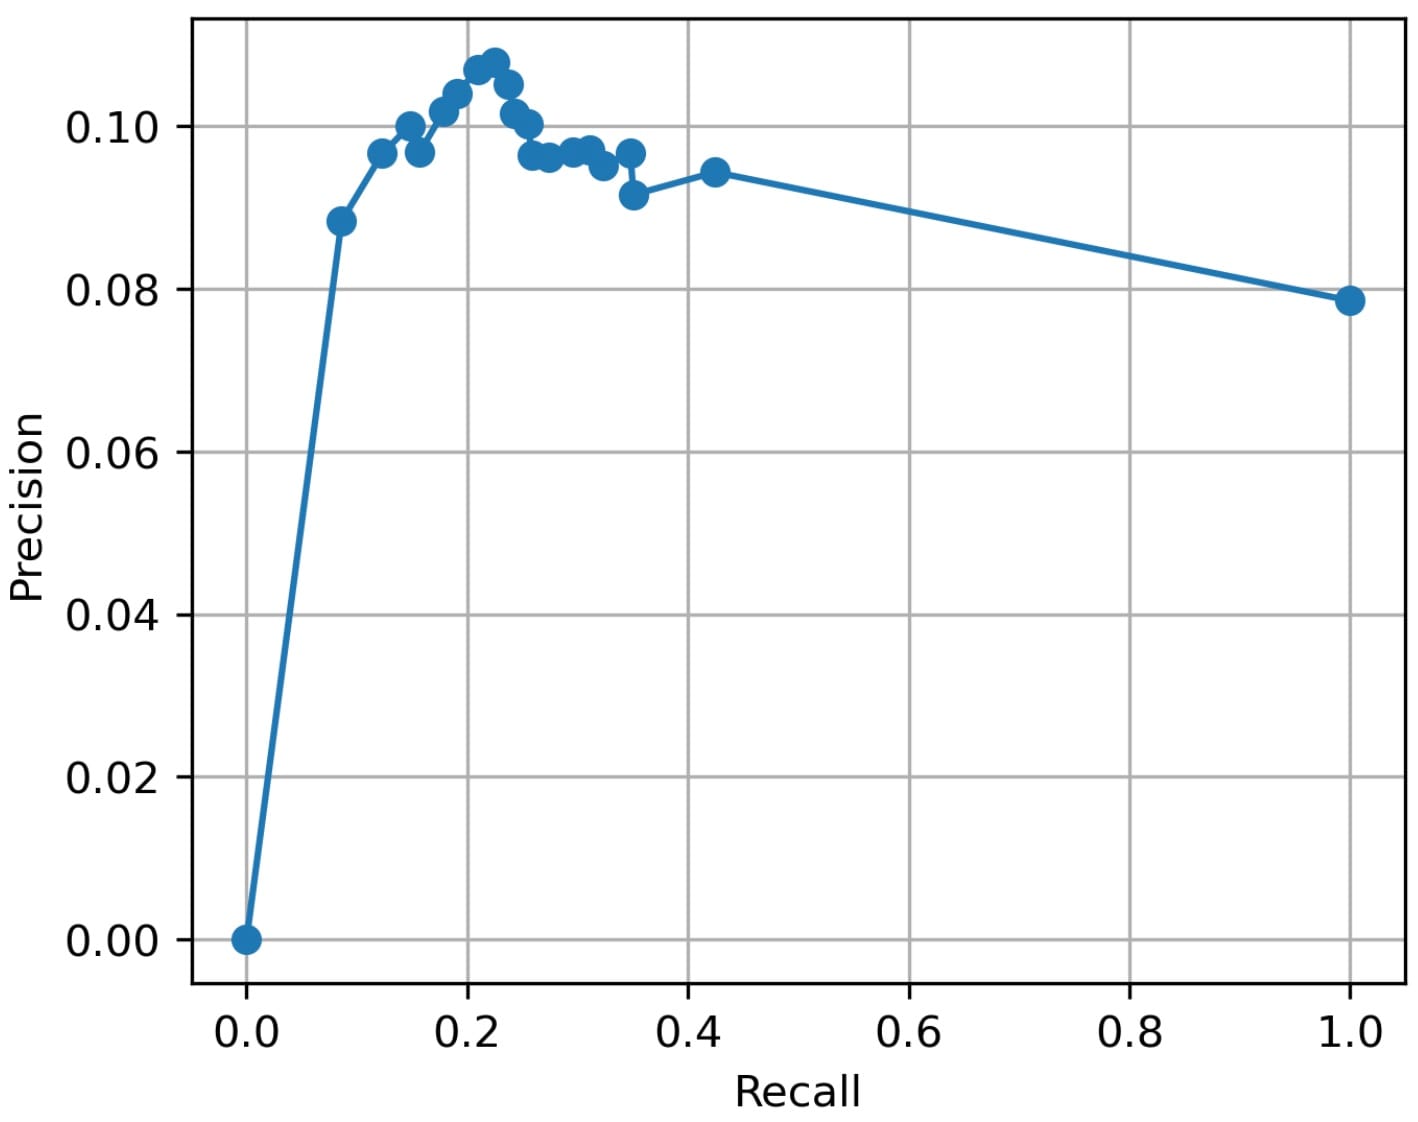
Logistic regression was the strongest statistical performer in the study, though the precision–recall curve shows that false alerts remained common. Precision peaks at about 11% on the plotted curve, at roughly 22% recall. At full recall, precision is about 8%. In practical terms, catching more labeled crash events came with a substantial false-alert burden.
Conclusion
The models provide complementary views of crash vulnerability. The continuous jump model tracks changes in the estimated risk state, while logistic regression ranks potential crash events. The low precision in the threshold comparison makes these signals more useful for prompting closer monitoring than for timing individual crashes.