Researchers: Anthony Giller and Liam Rodgers
Faculty Advisor: Dr. Dragos Bozdog
Introduction
When an issuer comes under financial stress, the value of its bonds depends in part on the likelihood that it can make its promised payments. This project develops a framework for valuing corporate bonds and credit default swaps (CDS) that explicitly incorporates the issuer’s probability of survival. The researchers applied the framework to airline issuers and built an interface for comparing model estimates with observed prices.
Methodology
The researchers used a reduced-form credit risk model to estimate survival probabilities and calculate risk-adjusted bond prices. They compared those estimates with observed prices and calculated the option-adjusted spread to fit (OASF), which expresses the adjustment needed to reconcile the model with the market price in basis points.
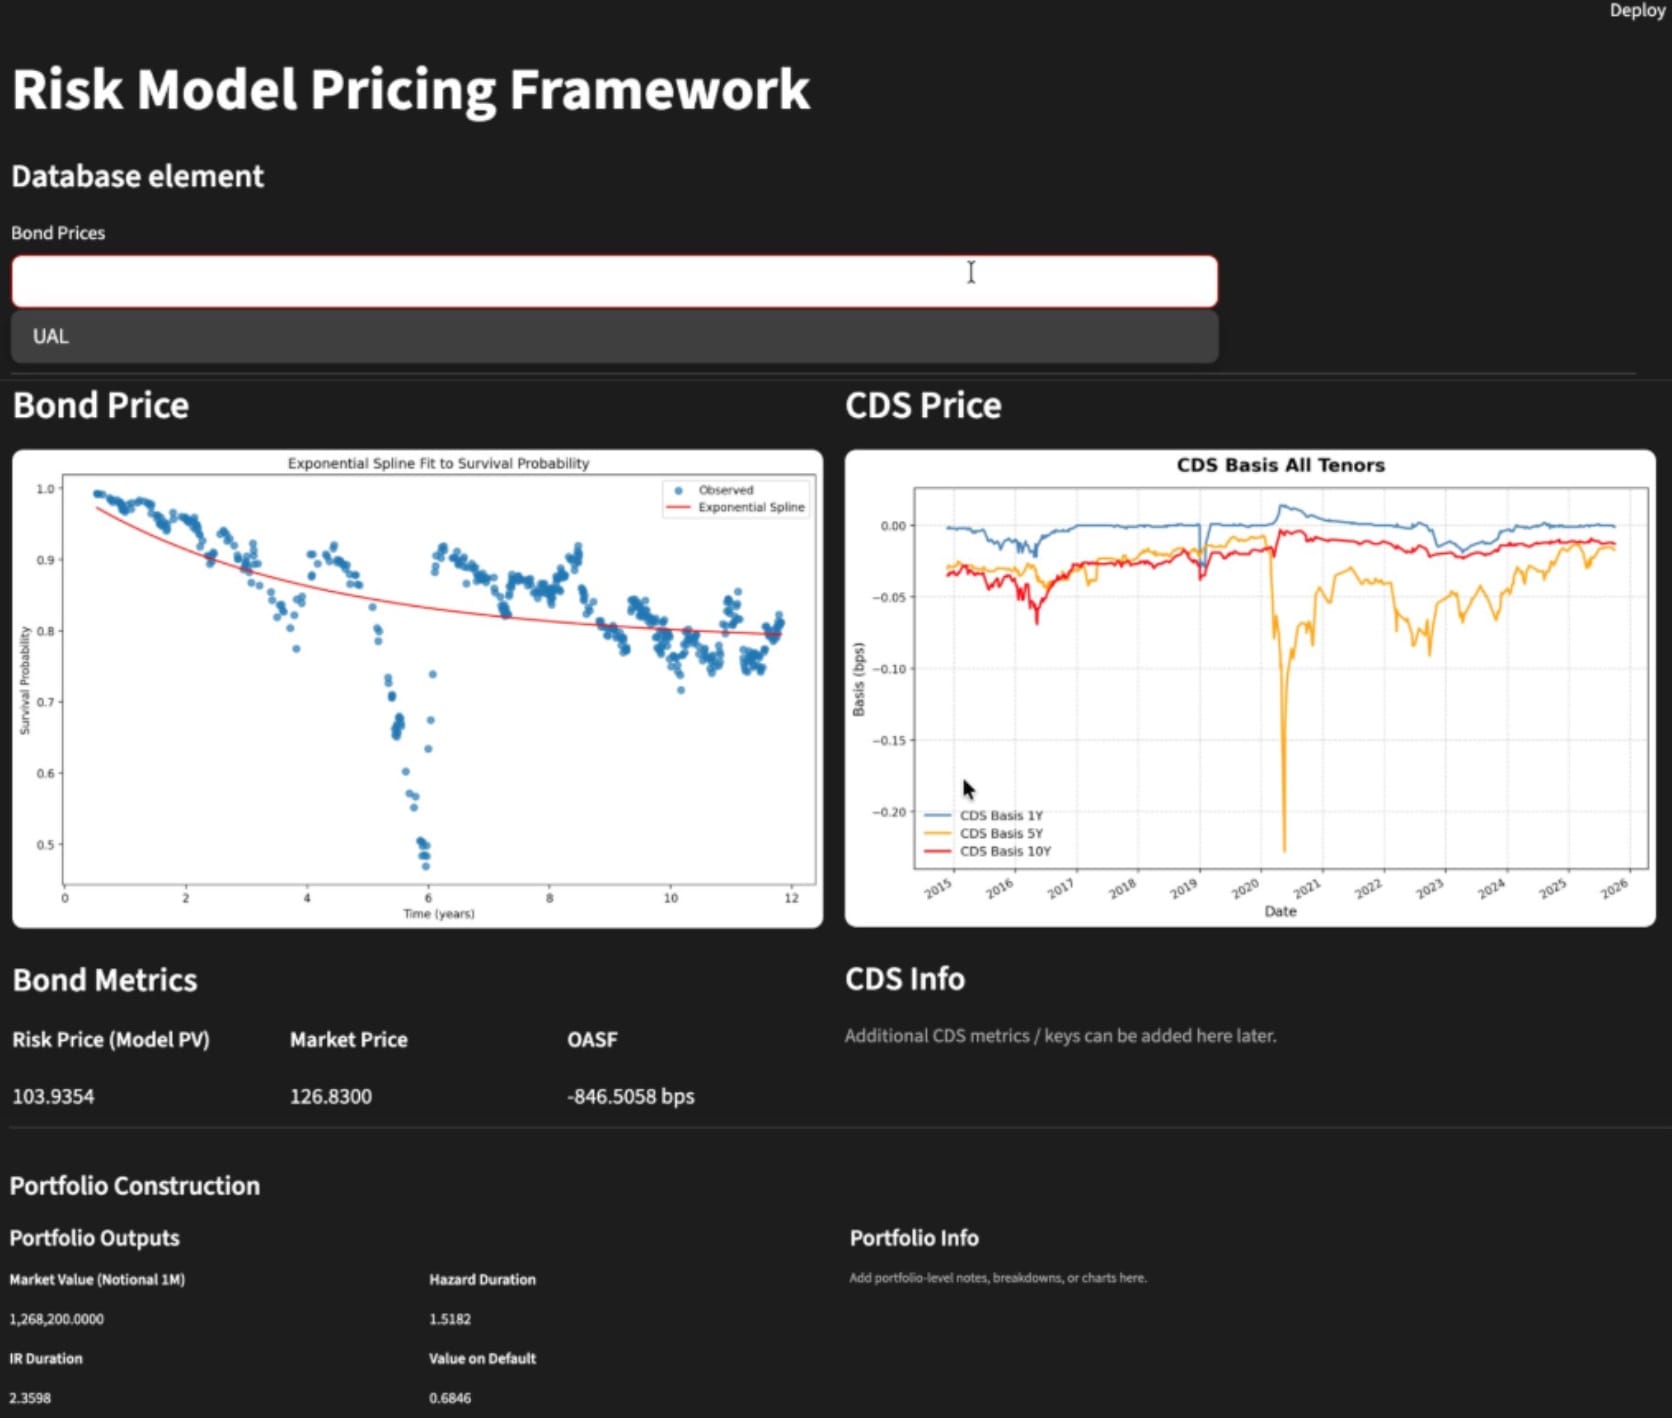
The application brings bond valuations, fitted survival curves, CDS basis across maturities, and portfolio risk measures into one view.
Results & Analysis
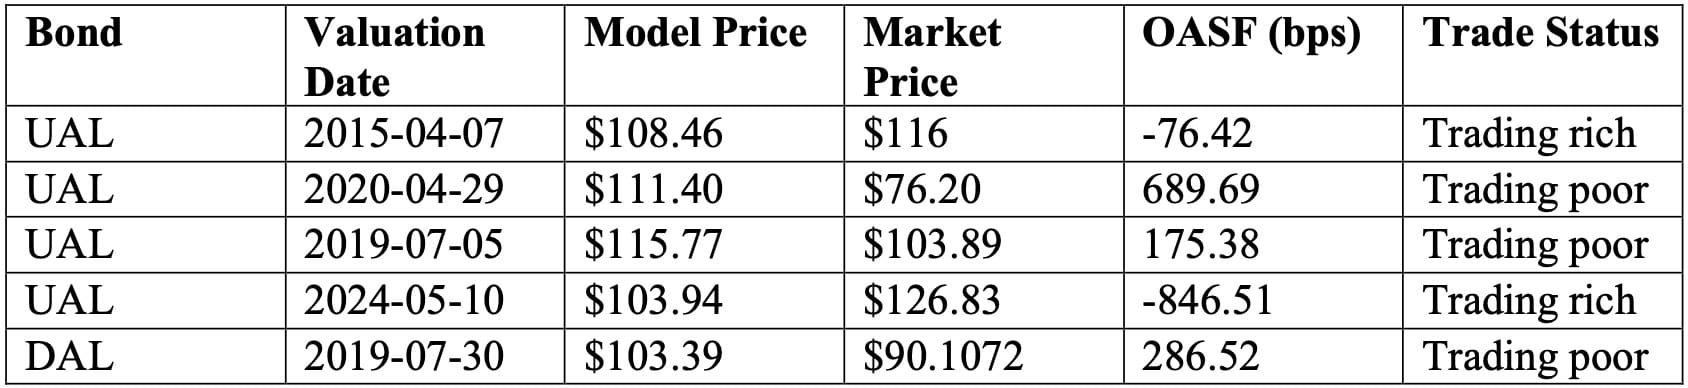
In the United Airlines examples, the spread was positive when the market price was below the model estimate and negative when it was above. In April 2020, the market price was 76.20 USD and the model estimate was 111.40 USD. In May 2024, the market price was 126.83 USD and the model estimate was 103.94 USD.
The interface offers two ways to investigate these gaps. On the left, the fitted survival curve summarizes the observed estimates across maturities. On the right, the CDS basis series show that the basis can move differently at different tenors. The five-year series, for example, shows a particularly sharp movement around 2020. Viewing the panels together helps an analyst investigate whether a bond’s pricing gap coincides with a broader change in the issuer’s credit pricing.
Conclusion
The framework gives analysts a way to express model-to-market pricing differences in spread terms and investigate them alongside CDS and portfolio measures. Because the trade classifications are relative to the model’s estimated value, they provide a starting point for relative-value and hedging analysis.