Researcher: Lauren Colasanti
Faculty Advisor: Dr. Jingrui Li
Introduction
How much market history should an AI trading agent use? This project examines how the length of a reinforcement learning agent’s memory affects its returns and risk when trading SPY. A short lookback gives the agent recent information, while a longer one allows it to consider more of the market conditions that preceded its decision.
Methodology
The study compared seven lookback windows, ranging from 3 to 60 days, across multiple random seeds. It evaluated each window using ending portfolio value, Sharpe ratio, volatility, maximum drawdown, and position changes. A buy-and-hold strategy provided a benchmark for the equity curves.
Results & Analysis
Most strategies rose together in 2021 and declined in 2022, but their performance spread out during the recovery. By the end of the plotted period, buy and hold was ahead of every agent curve. The choice of lookback window changed how the agents performed relative to one another.
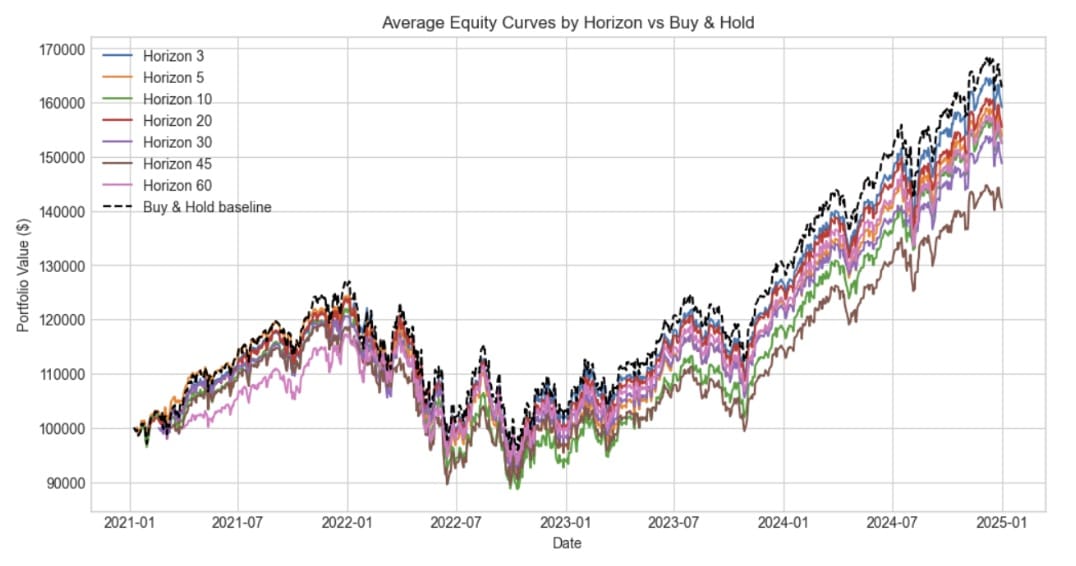
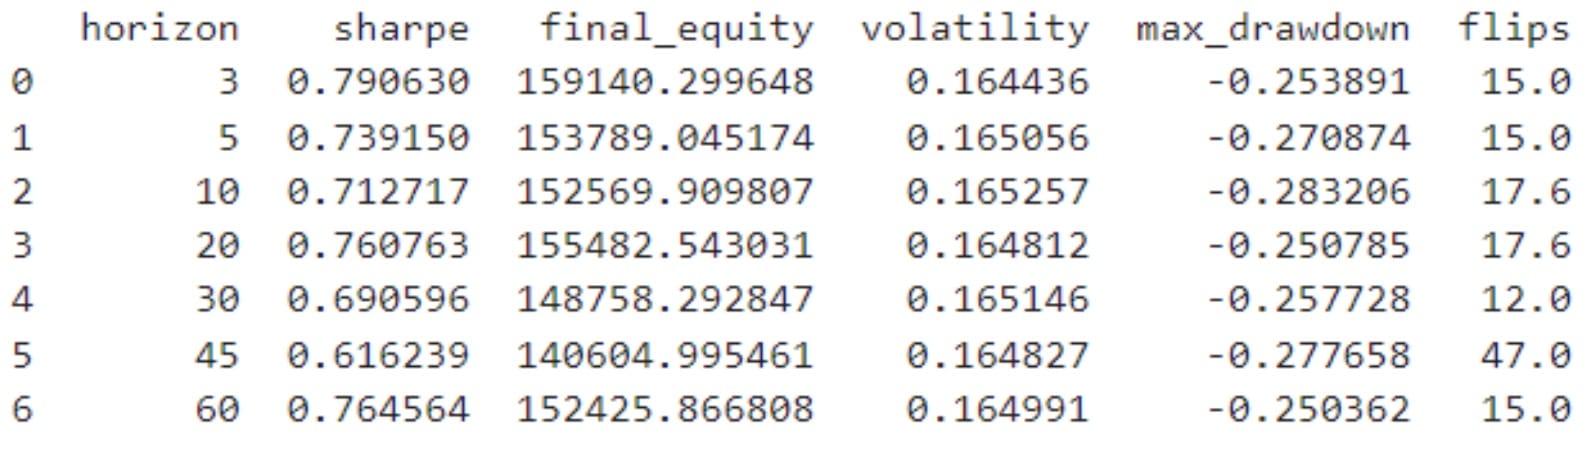
Among the agents, the three-day window had the highest Sharpe ratio, while the 60-day window had the smallest maximum drawdown. The three-day window recorded a Sharpe ratio of 0.791 and the highest average ending equity at about $159,140. The 60-day window had a drawdown of about 25.0% and a Sharpe ratio of 0.765. Volatility was close to 16.5% across all seven windows, so that metric alone would have missed differences in drawdown and ending equity.
Conclusion
The preferred lookback window depended on the strategy’s objective. The three-day window led on risk-adjusted performance among the agents, while the 60-day window limited peak-to-trough losses more effectively in the summary comparison. The buy-and-hold result shows why a passive benchmark matters alongside comparisons between model settings.