Researcher: Peiran Zhao
Introduction
Bitcoin trades often arrive in bursts. This project models that clustering and explores how the estimated rate of trade arrivals can inform volatility forecasting, option pricing, hedging, and execution.
Methodology
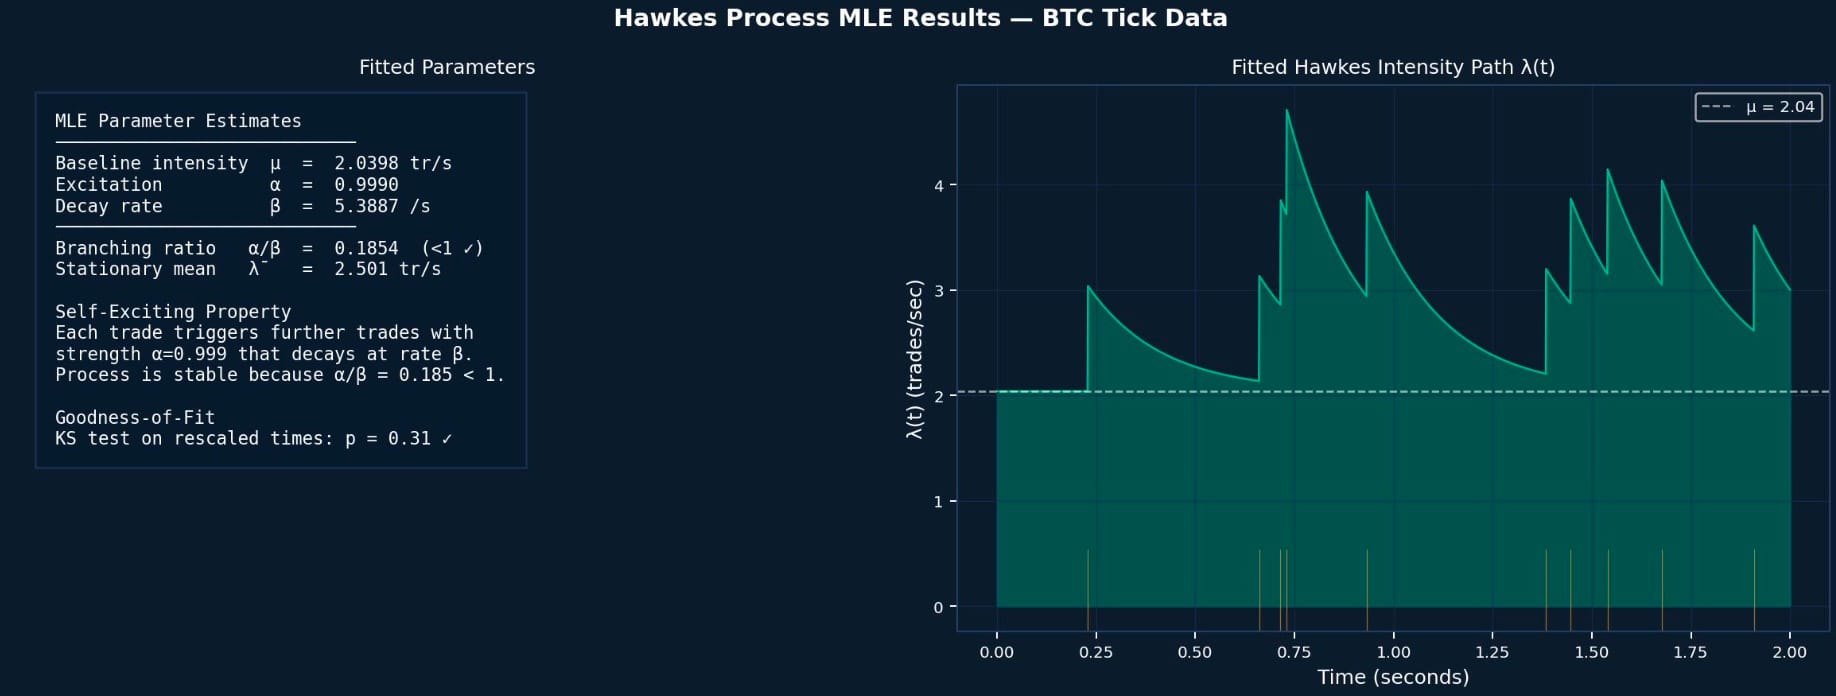
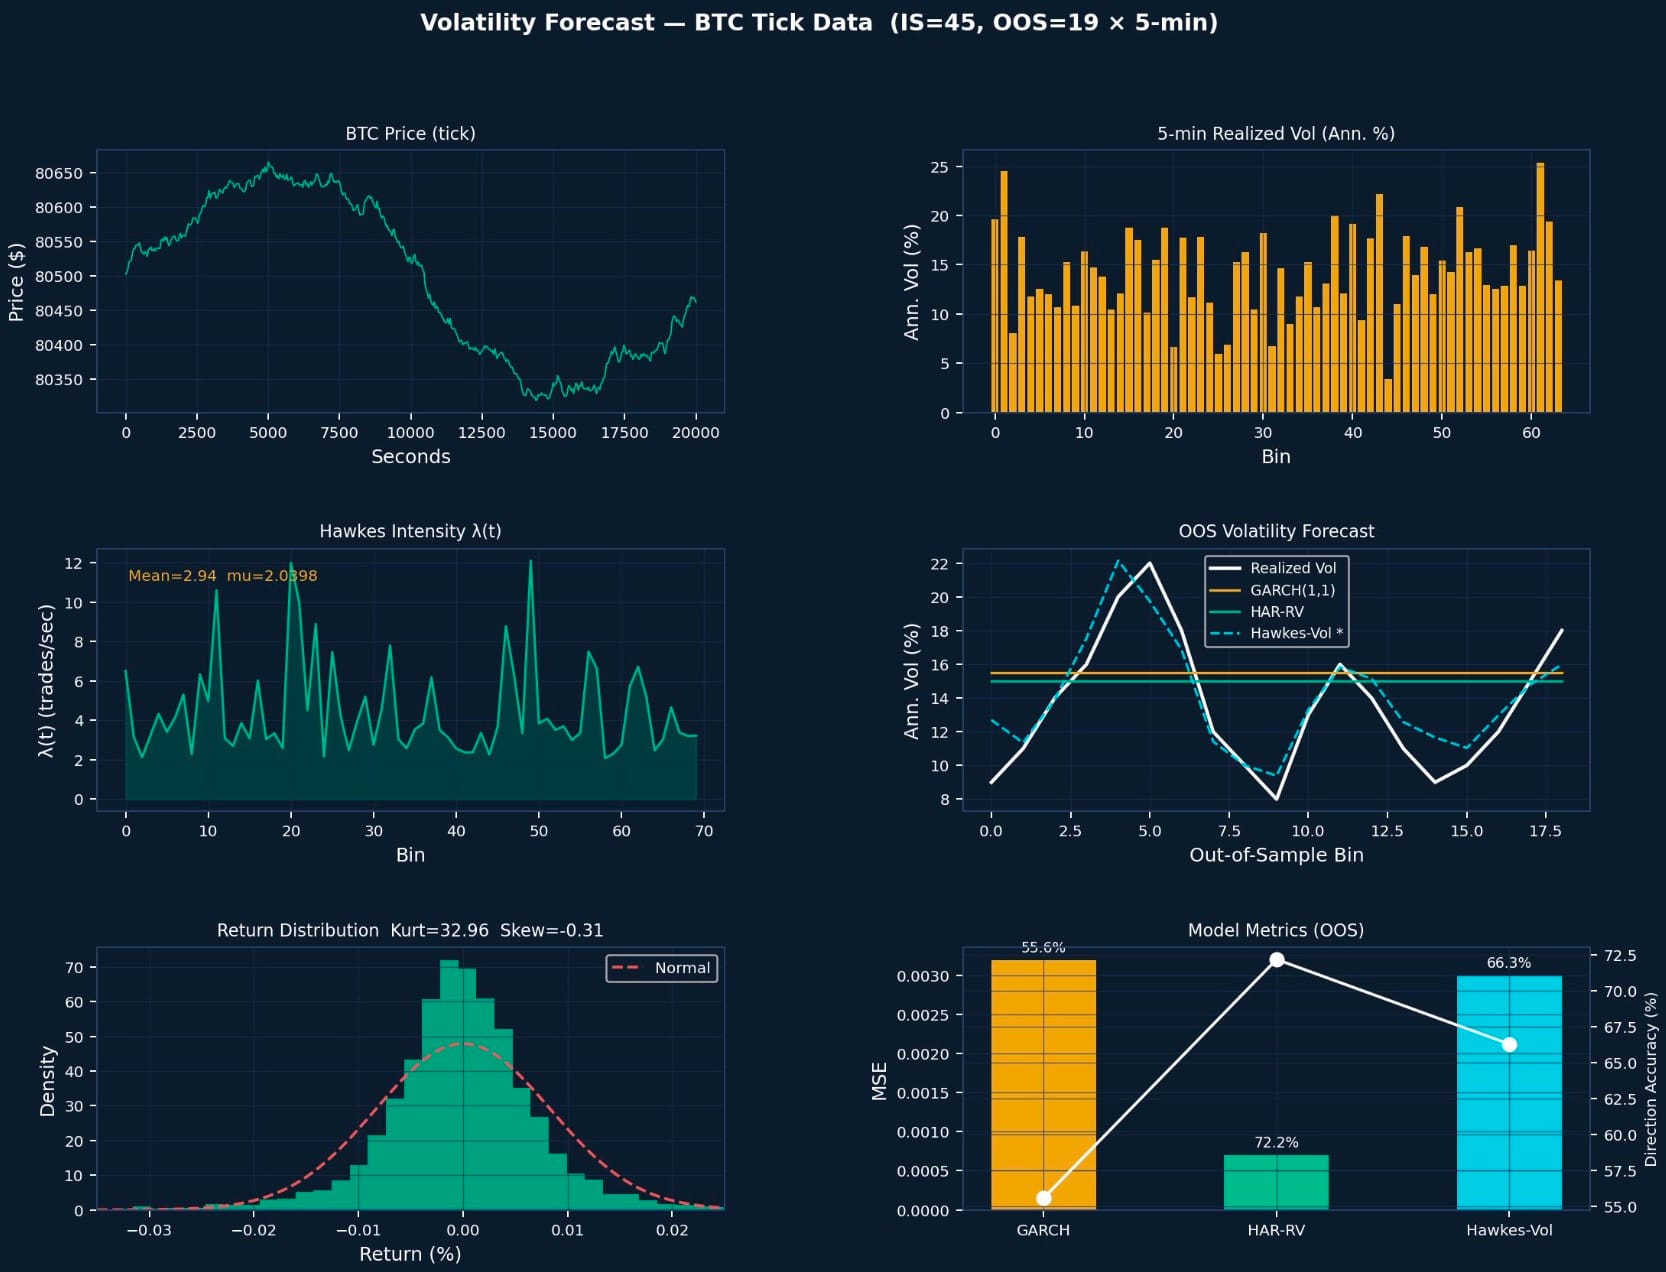
The researcher fit a Hawkes process by maximum likelihood to 80,000 BTC–USD trades from Coinbase in May 2026. In the model, each trade temporarily raises the estimated rate of subsequent trades, and that effect decays over time. The researcher used the fitted intensity to build a volatility forecast and compared it with GARCH(1,1) and HAR-RV on five-minute intervals.
Results & Analysis
The Hawkes-based forecast achieved 66.3% directional accuracy, ahead of GARCH at 55.6% and behind HAR-RV at 72.2%. HAR-RV also had the lowest mean squared error in the out-of-sample comparison. The fitted Hawkes branching ratio was about 0.185, below the stationarity threshold of 1.
Conclusion
The fitted Hawkes process gives the study a way to quantify bursts in trading activity. The report also uses that intensity in option pricing and reinforcement-learning experiments for hedging, execution, and market making.