Researchers:
Brendon Krupa
Ramya Sudhakar
Nicholas Ventrone
Faculty Advisor:
Dr. Dan Pirjol
Abstract:
Traders' anticipation of significant market events has resulted in the emergence of the W-shaped implied volatility smile in various options markets, particularly in short-dated options before corporate earnings announcements. We proposed to model the W-shape implied volatility smile in the absence of arbitrage. We accomplished this by using market option data for Amazon, Inc., and using parametric models, optimization and smoothing techniques to replicate the implied volatility smiles. The probabilities of the two main outcomes occurring, being under or over performance, will be obtained by constructing bimodal stock price risk-neutral density distribution. We created a bimodal stock price risk-neutral density distribution to obtain the probabilities of under or over performance, the two primary outcomes.
Results:
In this section, we will highlight three implied volatility models we determined to best recreate the W-shape curve for all maturities of the Amazon data. These models are Cubic Spline Double SVI Fit, SVI Wing Cubic Spline Fit, and SSVI Wing Cubic Spline Fit.
1. Cubic Spline Double SVI Fit:
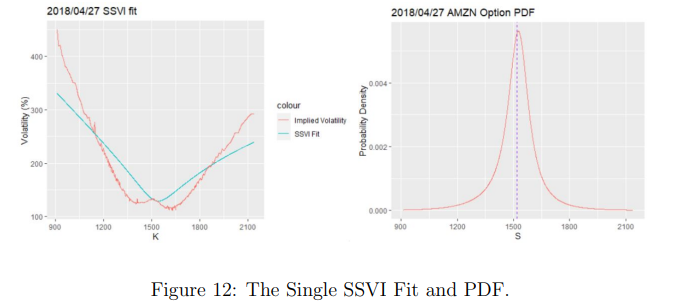
The below image shows that when attempting to fit a single SVI curve to the smile and its accompanying risk-neutral probability density function for the earliest maturity in the data set, April 27, 2018, the parameterization failed to capture the inflection points and changes in convexity.
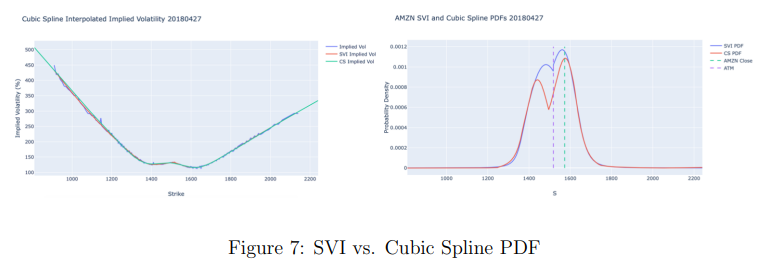
From the below image, we can see when we adopted a double SVI approach to fit one curve to the left wing and another to the right, we found a significant improvement in the fit.
The probability density functions of the cubic spline and double SVI fit are compared in the below figure. The cubic spline fit is superior as it is continuous at every point, while the SVI model is not continuous at the at-the-money point. The cubic spline fit also shows a more pronounced bimodal distribution with the higher peak at the price AMZN closed after its earnings announcement.
2. SVI Wing Cubic Spline Fit:
Using a raw cubic spline to fit the entire implied volatility curve provided a continuous and differentiable fit but created problems when analyzing the risk-neutral density curve due to unexpected fat tails. The W-shape was well-captured, but the model fell short in accurately representing the distribution.
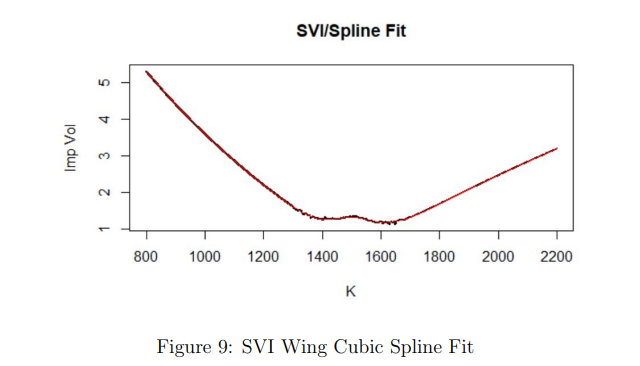
The above image shows the implied volatility curve after an SVI fit was applied to the wings. The black line in the figure represents this curve, and it appears to have some jaggedness in the W-shape, but the wings look fairly straight. The red line in the figure represents the cubic spline over the SVI wing implied volatility curve, and it is observed that the SVI wing cubic spline fit effectively smooths out the W-shape curve while closely tracking the values in the wings.
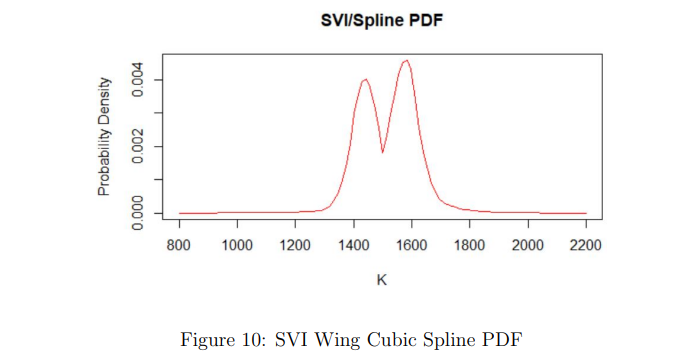
The above graph shows the risk-neutral density of the set of options on the April 27, 2018 maturity. This plot perfectly exhibits the bimodal distribution that we are looking for. The function is also continuous and differentiable, ensuring that there are no jumps in the data.
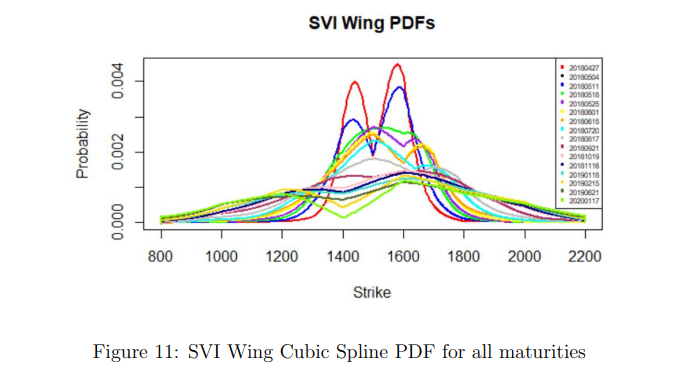
The above graph shows what the risk-neutral PDFs for all maturities look like overlaid with one another. As the time to maturity increases, the peaks of the probability distribution get smaller and smaller, and the size of the tails get larger and larger.
3. Single SSVI Fit:
The SSVI parameterization fit is insufficient as it cannot capture the wings, inflection points, and changes in convexity. The inflection point results in a higher ATM volatility parameter input, which causes the SSVI to fail to capture the wings. Additionally, the SSVI allows for a singular curvature, which cannot capture the dips around the inflection point, resulting in a flawed probability density function.
4. Double SSVI Fit:
To solve the issues faced with the single SVI fit, we implemented a double SSVI fit. Combining the SSVI right and SSVI left, we get the following fit, and resulting risk-neutral distribution.
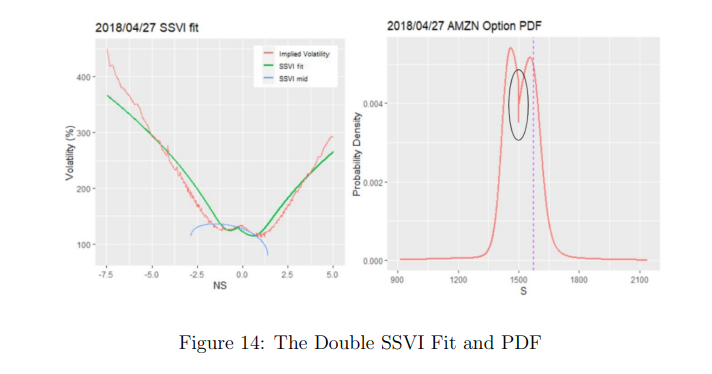
The double SSVI method accurately captures the W-shaped implied volatility curve and the bimodal distribution of stock prices. However, it faces some issues. Optimizing the curvature parameter affects the slope, resulting in inaccurate fitting in the wings. Additionally, the risk-neutral probability of the green line SSVI fit is discontinuous due to a jump caused by combining the SSVI right and SSVI left fits.
5. SSVI Wing Cubic Spline Fit:
To further improve this model, we looked into combining the cubic spline model with the SSVI model. Our most efficient and accurate results were produced from the SSVI wing Cubic Spline Model.
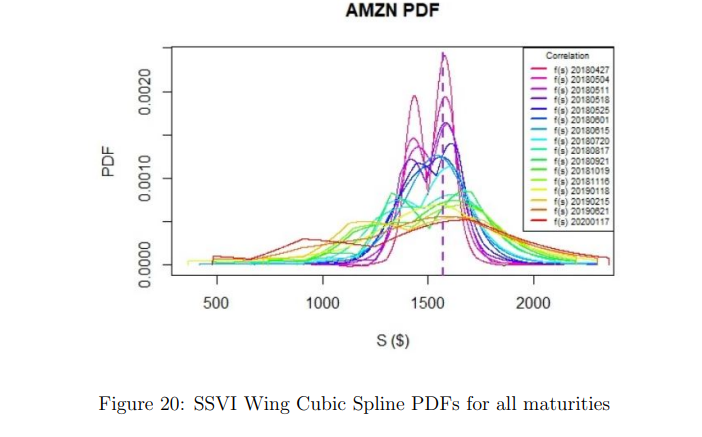
The relationship between different maturities can be seen clearly in Figure 20. The earliest maturities have a bimodal distribution of stock prices and a higher probability of under-performing or over-performing due to corporate earnings announcements. As maturities increase, the probability densities decrease and the distributions widen, with the W-shaped curve becoming less pronounced. The graph can be used for easy comparison of risk-neutral probability graphs for different maturities.
Conclusion
The US equity market can be predicted based on information from the options market, especially regarding earnings announcements. By analyzing the implied volatility curve, which has a W-shape, it is possible to accurately predict the distribution of stock prices around earnings announcements. This project achieved its objectives by explaining the dynamics of the implied volatility smile, modeling the W-shape curve without arbitrage by interpolating strike prices, and determining the stock distribution around earnings announcements. Three implied volatility models, including stochastic volatility inspired (SVI) parametric models, simple SVI (SSVI) models, and cubic spline interpolation, were used to obtain accurate results, which replicate the expected bimodal risk-neutral probability distribution of stock prices around earnings announcements.