Researchers:
Gloria Rumao
Faculty Advisor:
Dr. Homescu
Abstract:
The research paper aims to create a hybrid model that combines the strengths of both time series analysis and deep learning to achieve improved results. Unlike traditional statistical time series methods that build separate models for each series, this research emphasizes the importance of cross-learning, using multiple time series to train a single model. Time series data often exhibit hierarchical structures, and many forecasting tasks involve predicting multiple related time series. The proposed approach involves clustering related time series and developing a global model for each cluster. Instead of creating an individual model for each time series, this method leverages information from multiple time series simultaneously to build a more robust global model.
Methodology:
Data Collection -> EDA -> Statistical Models -> Deep Learning Models
1)EDA
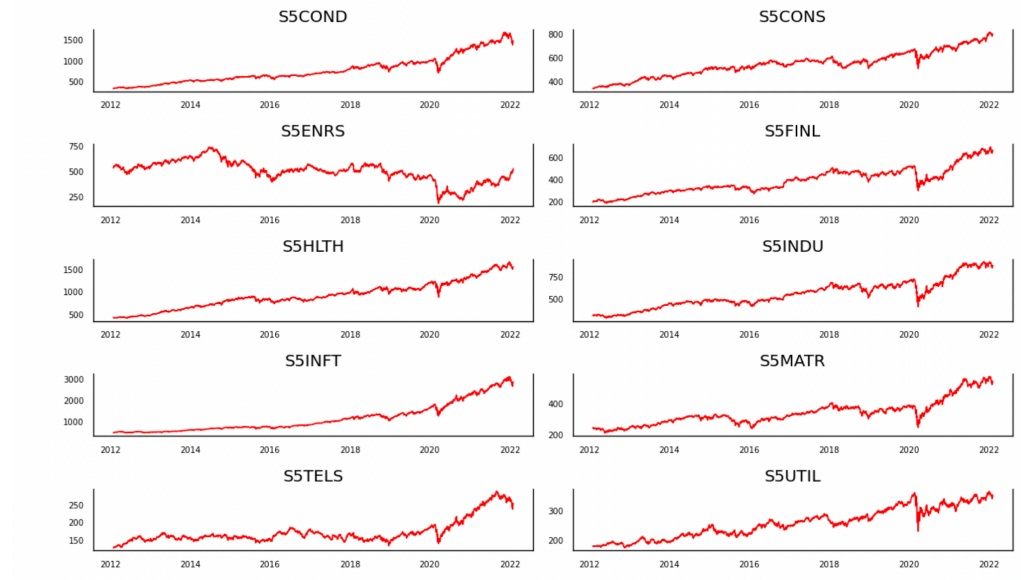
Several Python libraries are used for the analysis. These include "Os" for file handling and data retrieval, "Pandas" and "Numpy" for data manipulation, "Datetime" for converting data types, and "Matplotlib" and "Seaborn" for visualizing time series data. A versatile function is written for reading and formatting 11 SPY component files into a dataframe with datetime indexing while handling missing values. These components are then merged into a single dataframe for computational purposes.
2) Statistical Model Methodoligies
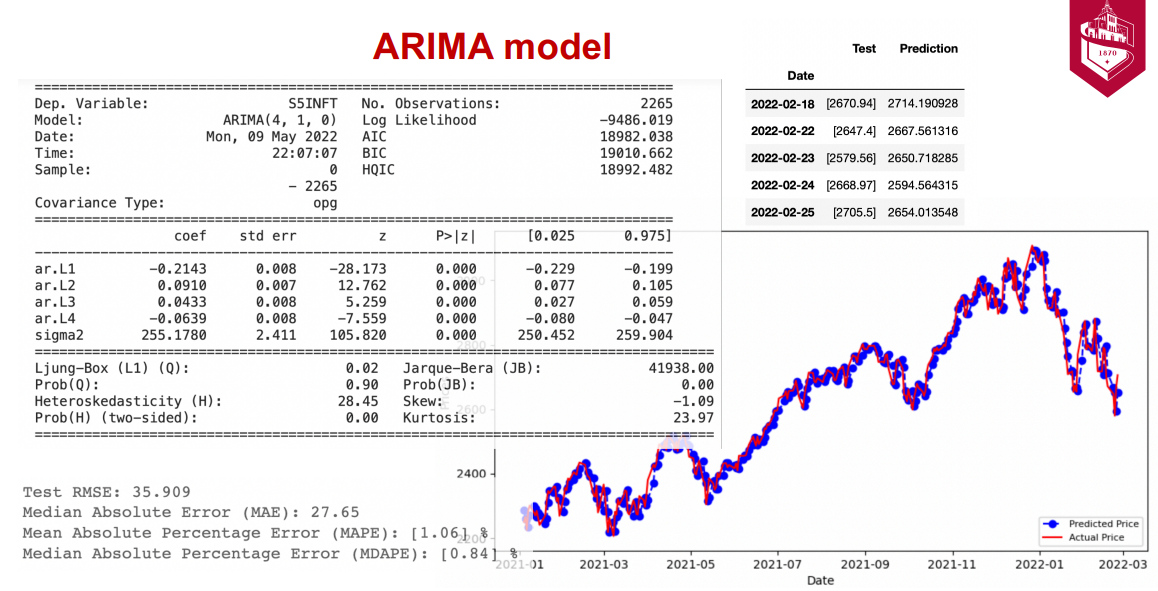
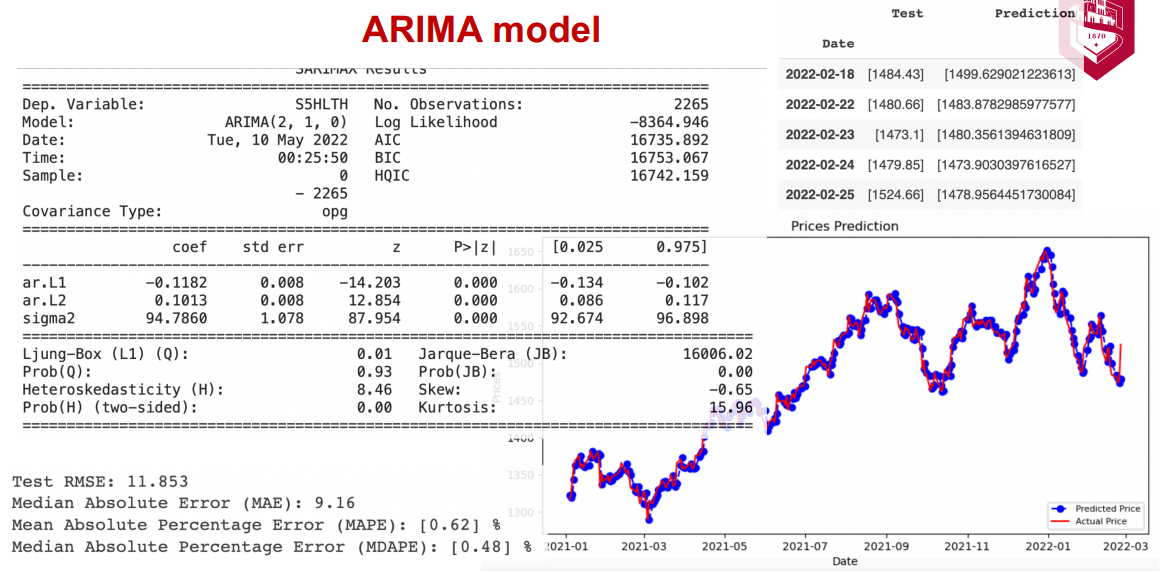
The Autoregressive Integrated Moving Average (ARIMA) model is used for forecasting non-stationary time series data. The model is made up of three components: autoregressive (AR), moving average (MA), and integrated (I). The AR component models the linear relationship between the current value of the time series and its past values. The MA component models the linear relationship between the current error of the model and its past errors. The I component differentiates the time series to make it stationary.
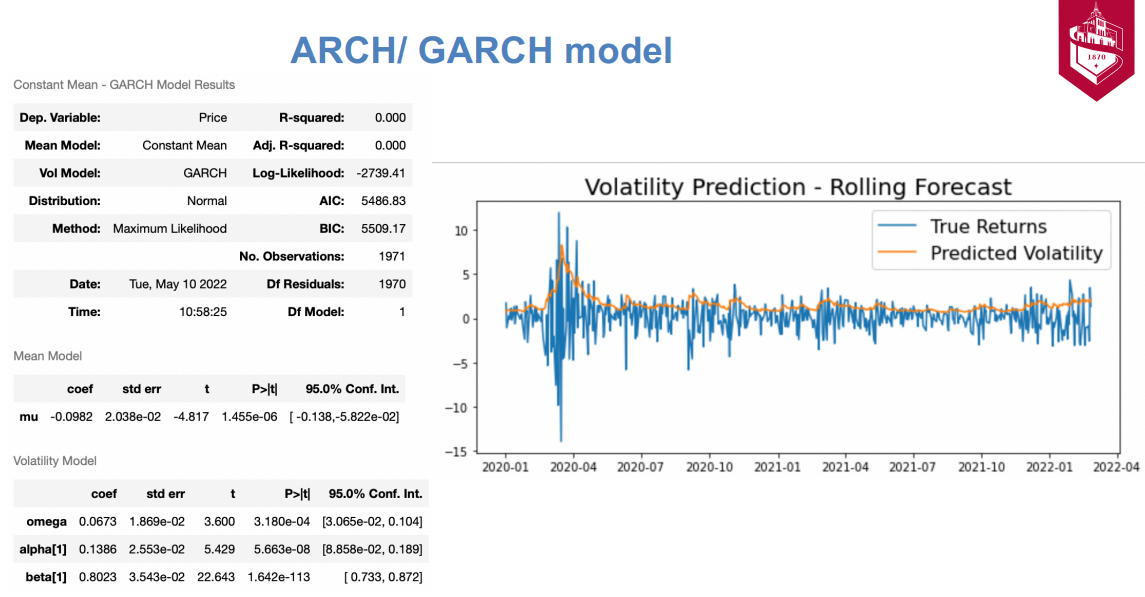
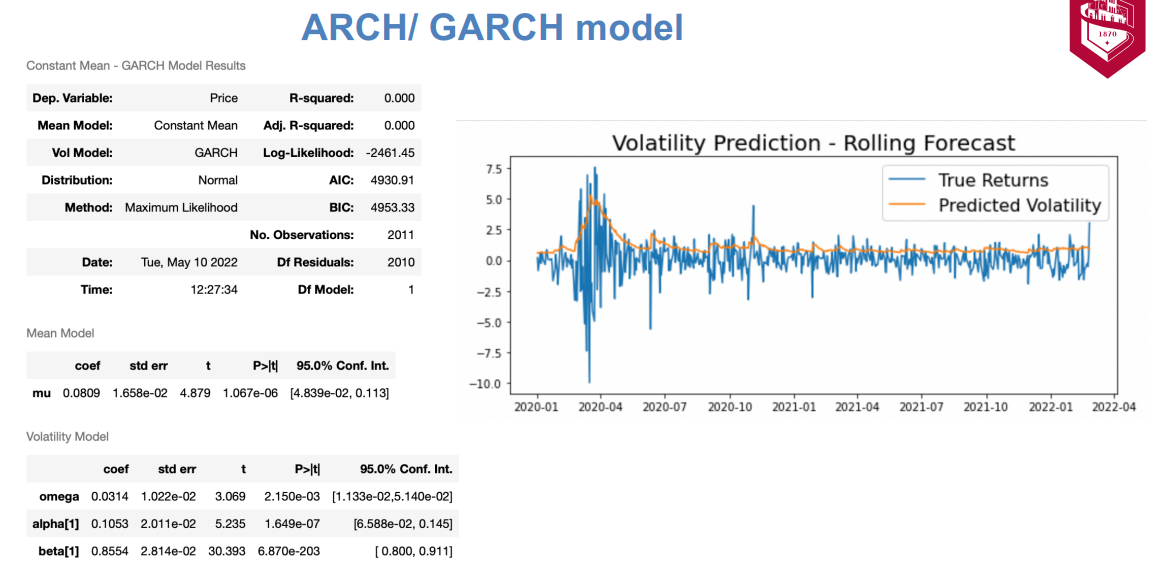
ARCH (autoregressive conditionally heteroscedastic) models are used to model the variance of a time series, while GARCH models are an extension of ARCH models that incorporate a moving average component. Both models are used to capture the volatility clustering phenomenon, which is the tendency for periods of high volatility to be followed by periods of low volatility, and vice versa.
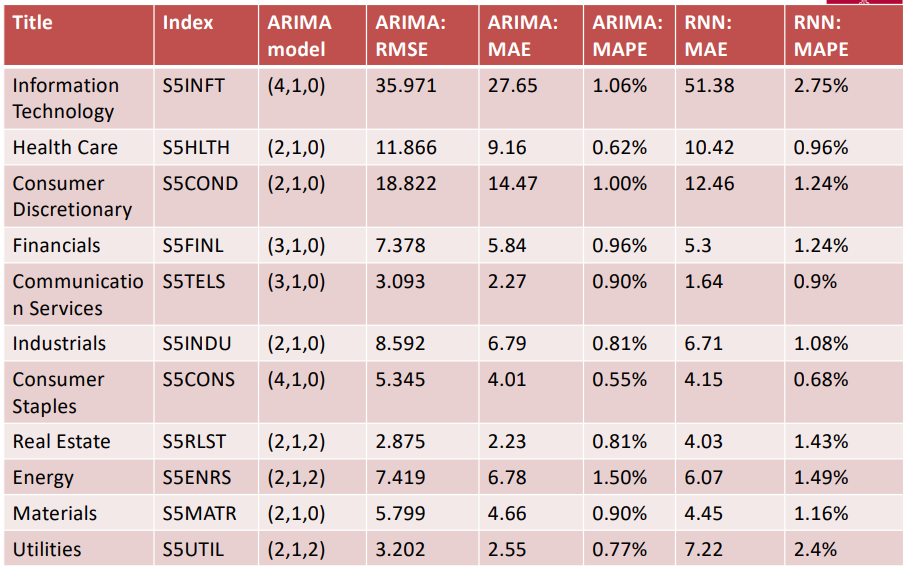
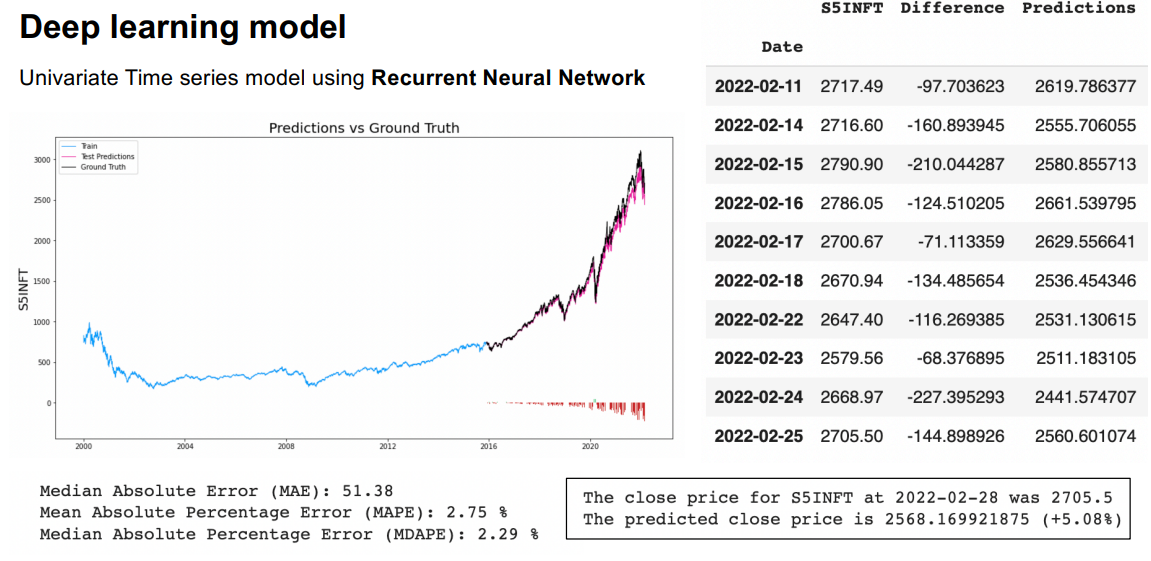
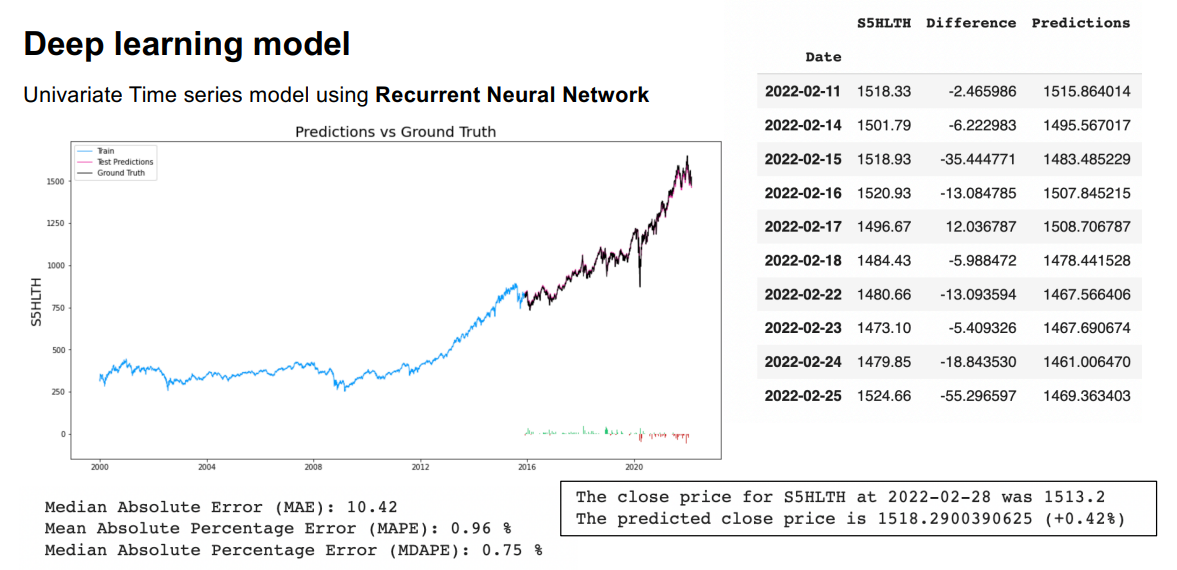
Vector Autoregressive Model and Recurrent Neural Networks are also used for forecasting the volatility of the S&P 500 index.
Results:
1) S&P 500 Information Technology
It comprises those companies included in the S&P 500 that are classified as members of the GICS information technology sector
Ticker: S5INFT SPY
Sector representation: 29.17%
1) S&P 500 Healthcare
It comprises those companies included in the S&P 500 that are classified as members of the GICS health care sector
Ticker: S5HLTH
Sector representation: 13.29%
Conclusion:
The ARIMA and deep learning RNN model gives better forecast results than the VAR model. The ARCH/GARCH model accurately forecasts the volatility of the stock. Though we can observe that the ARIMA model does a better job at forecasting some of the indices like S5INFT, S5HLTH, S5COND, S5FINL, S5INDU, S5CONS, S5RLST, S5MATR, S5UTIL compared to other models, the indices S5TELS and S5ENRS are predicted more accurately by the deep learning model.