Researchers:
Zach Townley-Smith
Evan Ganning
Scott Slawson
Faculty Advisor:
Dr. Khaldoun Khashanah
Abstract:
This paper examines the use of jump diffusion models to represent the S&P 500 ETF (SPY) price and analyzes the response in SPX option prices following a SPY price jump. The study uses high-frequency price data at a minute resolution from 2010-2012 and calibrates log-normal and double-exponential jump diffusion models to match market returns through maximum likelihood estimation.
The study provides insights into the suitability of jump diffusion models for representing the SPY price and the response of SPX option prices to a SPY price jump. It also highlights the importance of high-frequency data for calibration implementation and the use of jump detection and calibration methodologies for more stable model parameter estimation. The study suggests that further analysis could be done on high-frequency data to provide more insights into the dynamics of the SPY price and option prices.
Results:
1. Jump Detection
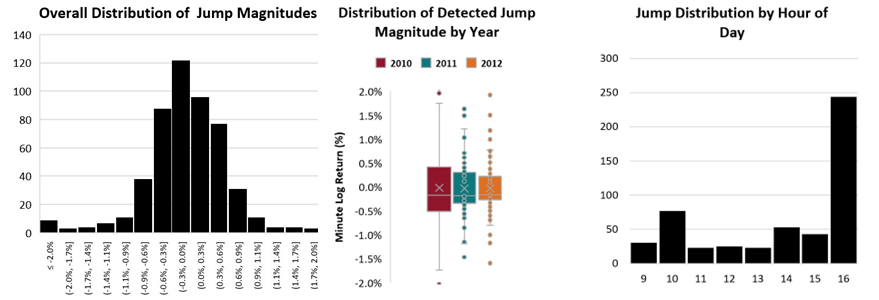
The monthly number of jumps detected using the methodology outlined by Lee and Mykland (2008) using minute resolution SPY returns from 2010-2012 is given in Figure 1 below, along with some jump distribution characteristics in.
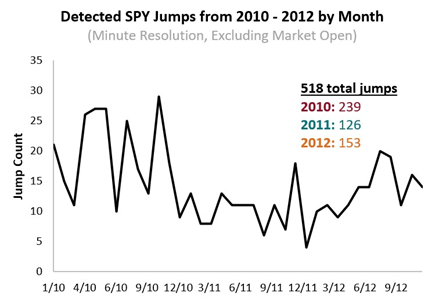
In the figure below, we see that the detected jump intensity was significantly higher in 2010 compared to the other two years with 239/518 detected jumps occurring in that year.
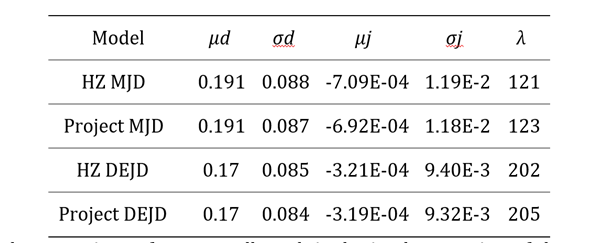
2. Model Calibration
The results of this trial are given below; in this implementation we are solving for µj, σj, λ in the log-normal jump diffusion model and µ1, µ2, p1 λ in the double exponential jump diffusion model.
The optimum jump intensity λ varied widely day by day.
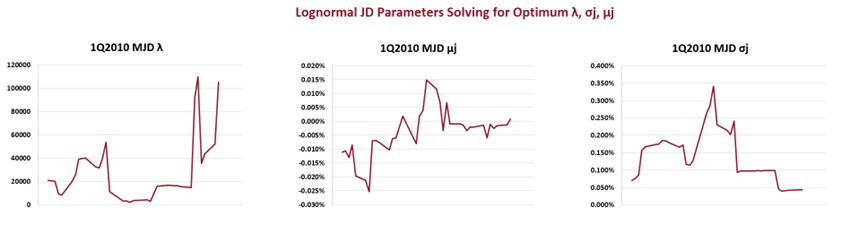
In order to stabilize the daily calibration, we removed λ from the maximum log likeliness optimization. This change helped enable consistent model predictions, and is the calibration approach used in the remainder of the paper.
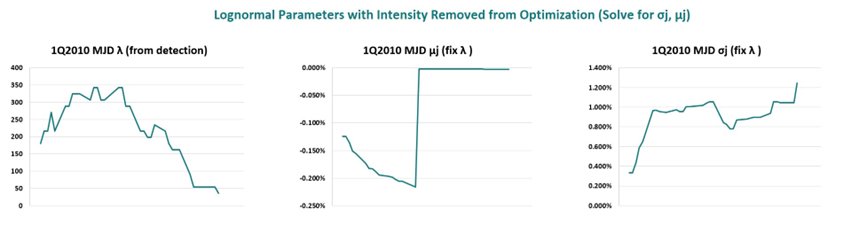
The graphical results of this trial are give below-
3. Option Pricing
Below table provides the average pricing error-
|
|
MJD |
BS |
DEJD |
|
OTM |
-0.4 |
-0.4 |
-2.0 |
|
ATM |
1.1 |
1.5 |
0.0 |
|
ITM |
3.4 |
3.0 |
3.3 |
Below table provides the standard deviation of this error for out-of-the-money, at-the-money, and in-the-money options-
|
|
MJD |
BS |
DEJD |
|
OTM |
5.6 |
5.6 |
5.1 |
|
ATM |
8.6 |
8.4 |
8.7 |
|
ITM |
8.0 |
7.9 |
8.1 |
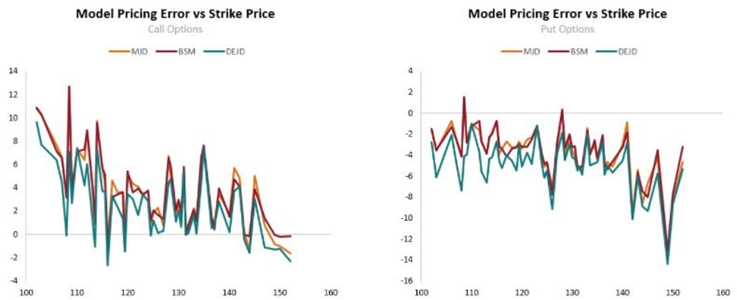
The below table compares the pricing error of each model vs the strike price of the option, separating by call or put options. All three models tended to overestimate call options and underestimate the value of put options. The DEJD model was seen to outperform MJD and BSM in pricing call options more accurately, though it exhibited the largest error in pricing put options.
Conclusion
This study suggests that Merton's log-normal jump diffusion model and Kou's double-exponential jump diffusion model provide a better fit to the distribution of market SPY ETF minute resolution log returns than the Geometric Brownian motion model. However, when using these models to adjust European SPX option prices, the expected adjustments are not as clearly visible in market option data. Additionally, the study found that the majority of lead/lag response times between SPY jumps and SPX option price reactions occur within the 1 minute resolution used in the study. Finally, the study notes that, as with prior work, daily calibration of jump diffusion models to match the underlying asset's return distribution leads to unstable parameter estimates.