Researchers:
Shaan Huq
Shemar Yap
Faculty Advisor:
Dr. Christian Homescu
Abstract:
ESG-based investing interest is growing, with machine learning showing promise in analyzing ESG data. A modified Fama-French model with machine learning techniques was used to see if ESG and GC show materiality on excess returns. ESG and GC both display materiality on excess returns, with GC showing a greater degree of materiality. ESG portfolios have small returns and negative skew with excess kurtosis, and GC has the highest number of companies in the data. Improving ESG/GC scores can lead to some financial out-performance, but the possibility exists that companies already out-performing implement ESG. ESG/GC can be used as a risk management method, with ESG Best-in-Class exhibiting the lowest risk. Results enhance ESG-based investing knowledge and opportunities for future analysis.
Results:
Factor Model Integration
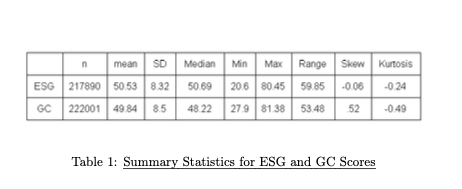
Following statistics on 217890 ESG observations and 222001 GC observations gives a good idea on how the ESG and GC data looks like.
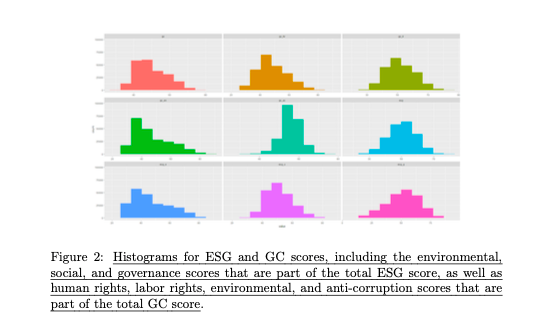
Histograms are generated for both ESG and GC scores which provide a better understanding of distributions through visuals as follows. They confirm that GC score is mostly right skewed while ESG score is more normally distributed.
An attempt was made to transform the right-skewed GC score, and the histograms below show the distribution after the transformation.
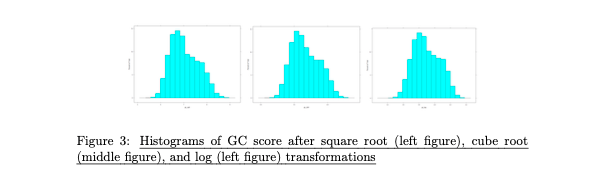
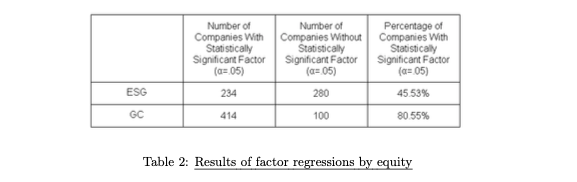
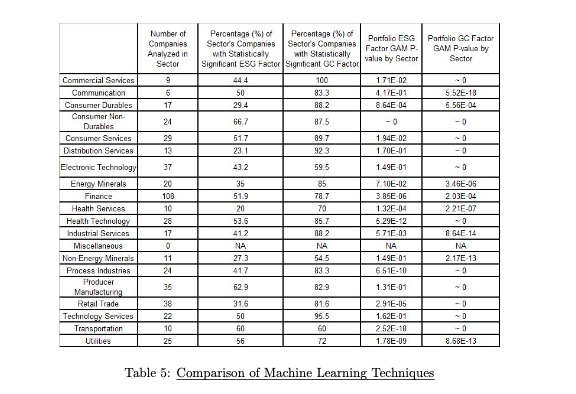
Table following shows the results of the factor regressions by equity, in particular showing the number of companies with/without a statistically significant ESG/GC factor, as well as the percentage of total companies with a statistically significant ESG/GC factor.
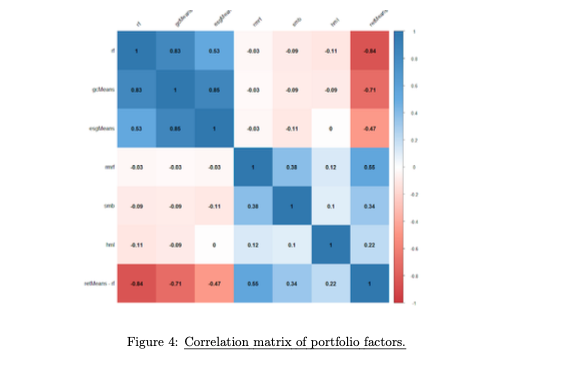
The portfolio was defined from all the tickers that were analyzed previously, and a correlation matrix of the factors was created, as shown below. The main finding of it is that excess return has a noticeable correlation with GC and ESG.
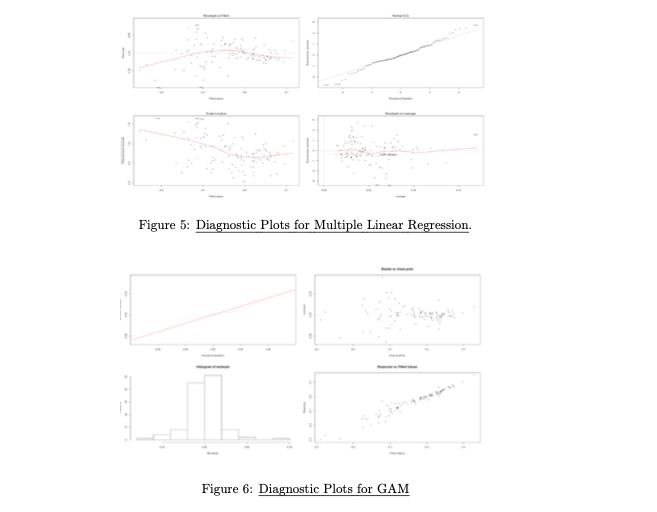
From the diagnostic plots below for the multiple linear regression, it is seen that residuals vs. fitted have points that are quite spread out, with them more concentrated to the right. Normal Q-Q is fairly linear, showing that residuals are normally distributed. Scale-Location has a somewhat horizontal line with points spread out. Residuals vs. Leverage has a few points that are farther out, but no major outliers since none past the Cook’s distance line.
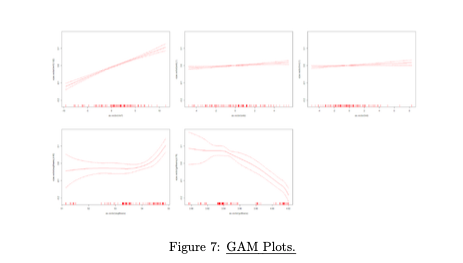
For GAM plots, the Q-Q plot is fairly linear. Residuals vs. Linear Predictions have spread out points. The histogram of residuals has a normal distribution. Response vs. Fitted Values has fairly linear points as well. Overall, GAM looks like a good data analysis model.
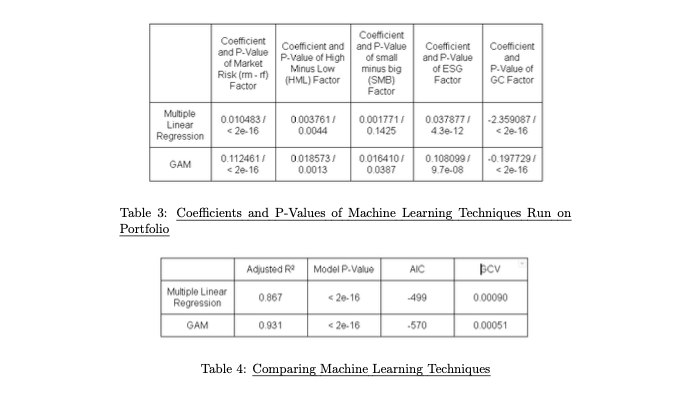
The coefficients and p-values for each factor using each machine learning method are shown in Table 3. Multiple linear regression and GAM can also be compared. The adjusted R2, p-value, AIC, and GCV for both models are shown in table 4 below.
Financial sector has the most companies in the dataset, potentially impacting portfolio results on ESG/GC factors. Around 40-50% of companies have statistically significant ESG factors, with Consumer Non-Durables and manufacturing producers having higher percentages. Around 80-90% of companies have statistically significant GC factors, with Commercial Services and Technology Services having the highest percentages. Non-Energy Minerals and Electronic Technology have lower percentages of significant ESG factors, likely because they don't follow the United Nations Global Compact principles closely. Results suggest that both ESG and GC have materiality in every sector to varying degrees.
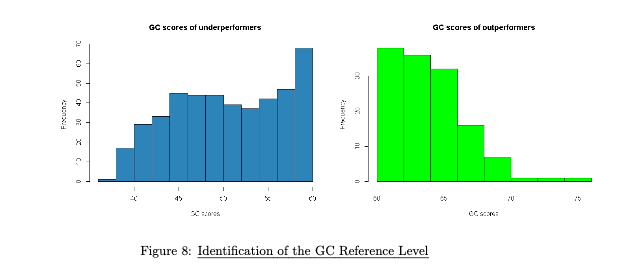
The results of the factor regression showed that Global Compact scores are more relevant to equity returns across all sectors, and as a result were selected as the objective metric for developing ESG-based portfolios. To create the ESG portfolios, the returns matrix was split at the Global Compact reference level of 60 to create under-performers and over-performers matrices. The reference level was determined by trial and error until the distributions of the GC scores were oppositely skewed. The results can be seen below.
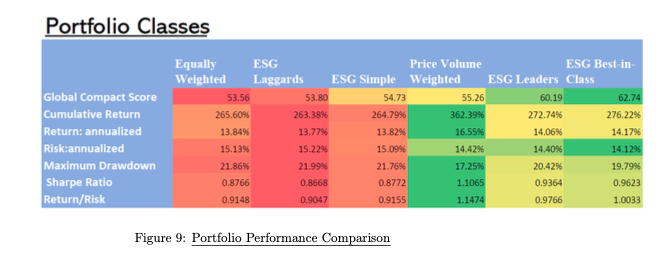
Following table compares six portfolio classes' performance metrics. As GC score increases, cumulative and returns decrease until hitting a portfolio value of 60, where they start to increase. Portfolio risk decreases with an increase in GC score, and maximum draw-down generally decreases. Sharpe ratio and return/risk improve with the increase in GC. ESG simple portfolio underperformed due to US equities performing worse than peers in other regions at any ESG level. Price Volume portfolio outperformed ESG Best in Class and ESG Leaders in all categories except risk, suggesting demand-based strategies outperform ESG-based ones. Results are in the table.
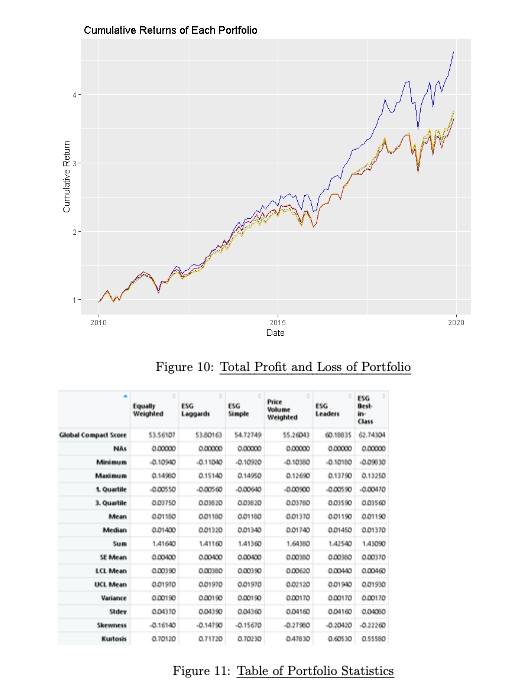
The statistical analysis of the ESG-focused portfolios reveals that the returns have a slightly negative skewness and low kurtosis. This suggests that there are more positive returns with infrequent small losses, resulting in a distribution of frequent small gains. The price volume portfolio displays similar characteristics, with more negative skewness and lower kurtosis, making it a better option for long-term returns. On the other hand, the simple, ESG laggards, and ESG simple portfolios show less negative skewness and are more heavy-tailed than the price volume, ESG Leaders, and ESG Best in Class portfolios.
Conclusion:
The paper identifies five research questions which adds to knowledge related to ESG based-investing. The first research question found out that the GAM model was the best out of all to be used with ESG data efficiently and get desired results. During the research done for question two, it was seen that both ECG and GC display materiality on financial performance. In the third question, some characteristics of ESG/GC based portfolios and whether there is sector bias. ESG portfolios show less variance between returns. ESG may be suitable for longer positions. The conclusion of sector bais was inconclusive since there was bias in the raw data set.The research done under the fourth question discovered that the integration of GC/ESG factors can outperform to a certain extent when they surpass the threshold which is a GC score of 60. Fifth question answered that one of the main benefits that ESG-based portfolios tend to have is a better return and risk profile or Sharpe ratios in comparison with other portfolio strategies. To conclude, the paper finds that ESG-based investing knowledge base has been enhanced with the interesting results products by project.