01First Place
The Bagholders
Rutgers University
Yaning Wu · Elizabeth Pisakhova
Prize$2,000
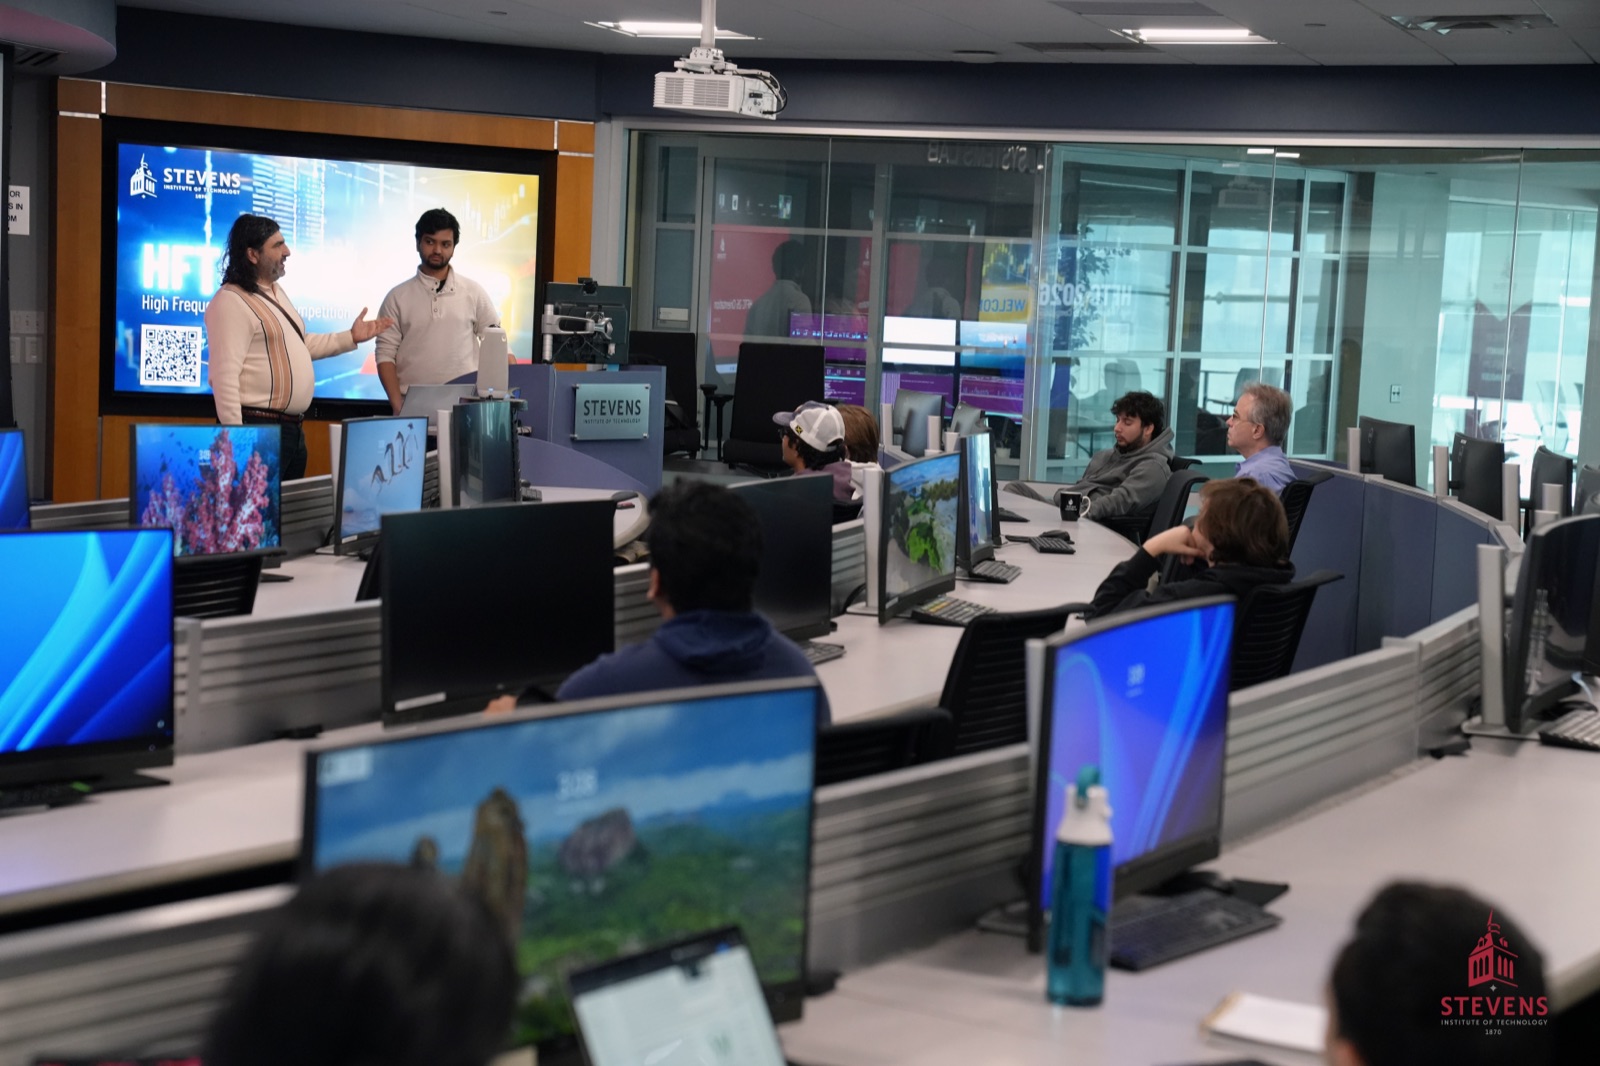
Global competition retrospective
Five weeks of intraday algorithmic trading on the SHIFT platform, with students competing from ten countries.
Competition overview
HFTC-26 was a five-week competition in which teams designed, coded, and deployed intraday algorithmic trading strategies in Python on the SHIFT platform. The 2026 edition drew 194 registered students from 46 universities in 10 countries. Stevens, NYU, and Columbia sent the most students, and 16 came from three Ivy League universities: Columbia, Cornell, and Penn.
Each week introduced a new market-condition theme, with algorithms ranked by PnL under an F1-style scoring system — points rising toward later rounds, plus a bonus for the best Sharpe ratio — and a 200-trade-per-day execution minimum. The 2026 edition partnered with Risk.net, and the award ceremony was held in May 2026.
Who competed
194students
166 United States 86%
28 International 14%
India 10 · France 4 · Mexico 4 · Romania 3 · UK 2 · Canada 2 · Germany, Netherlands & Singapore 1 each
Top universities of 46
The competition
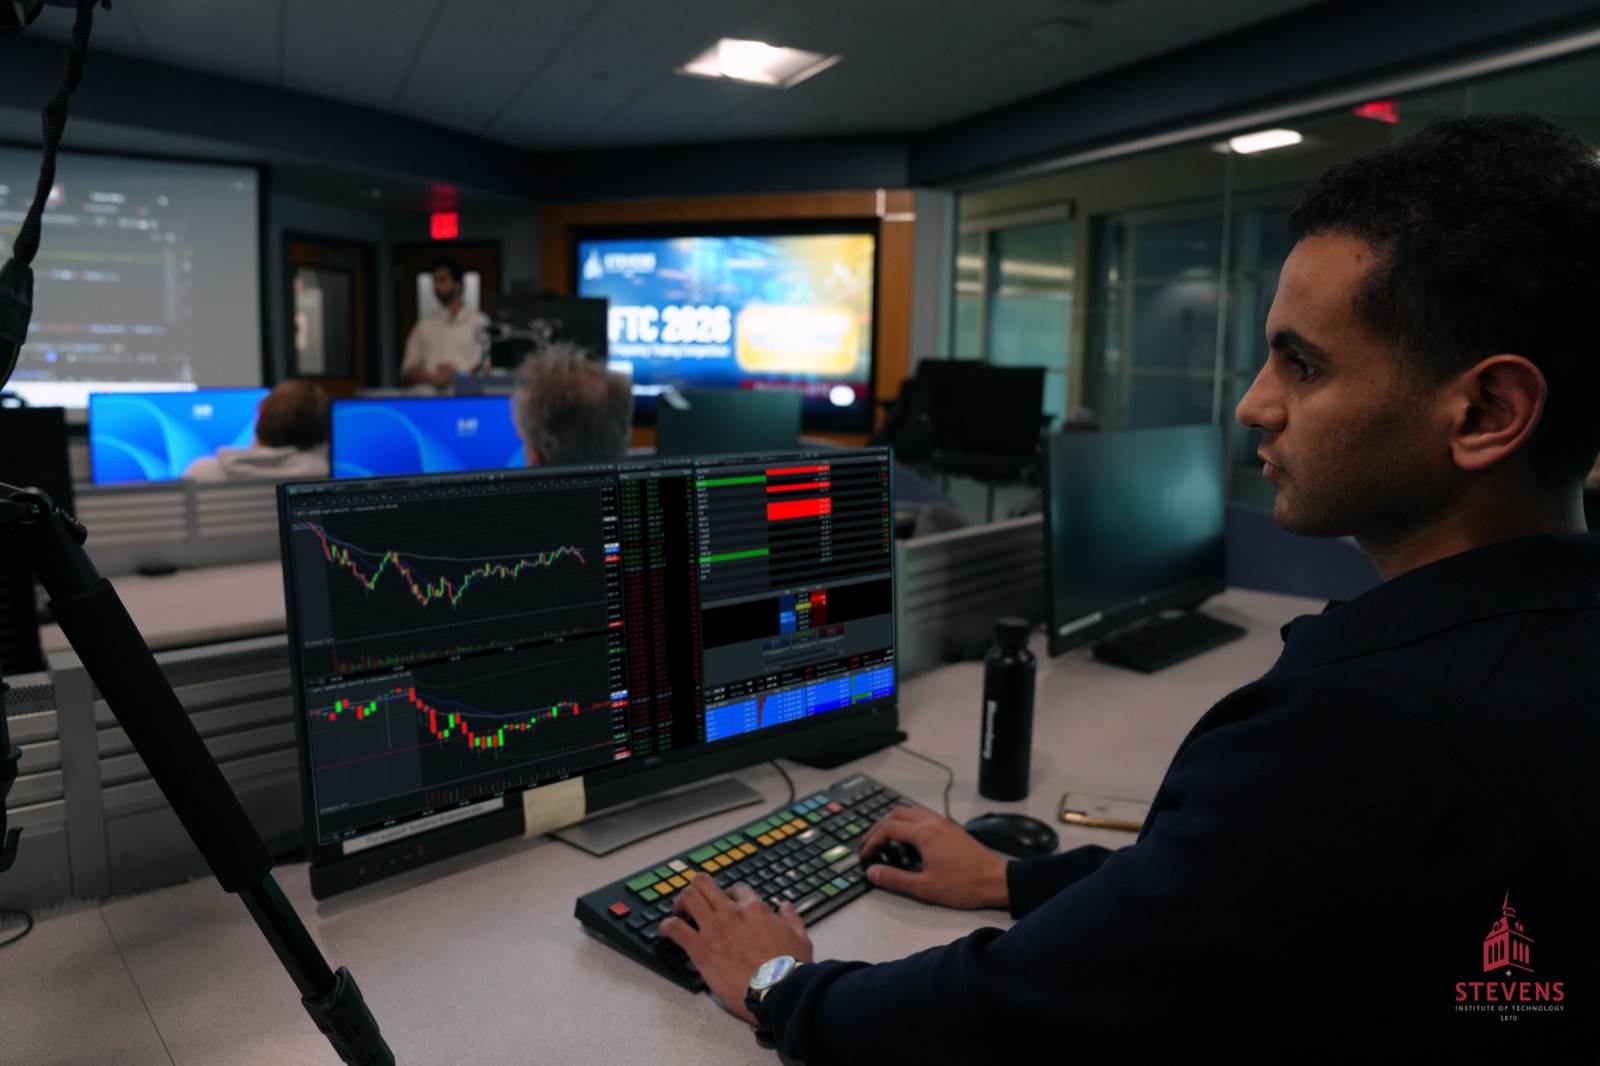
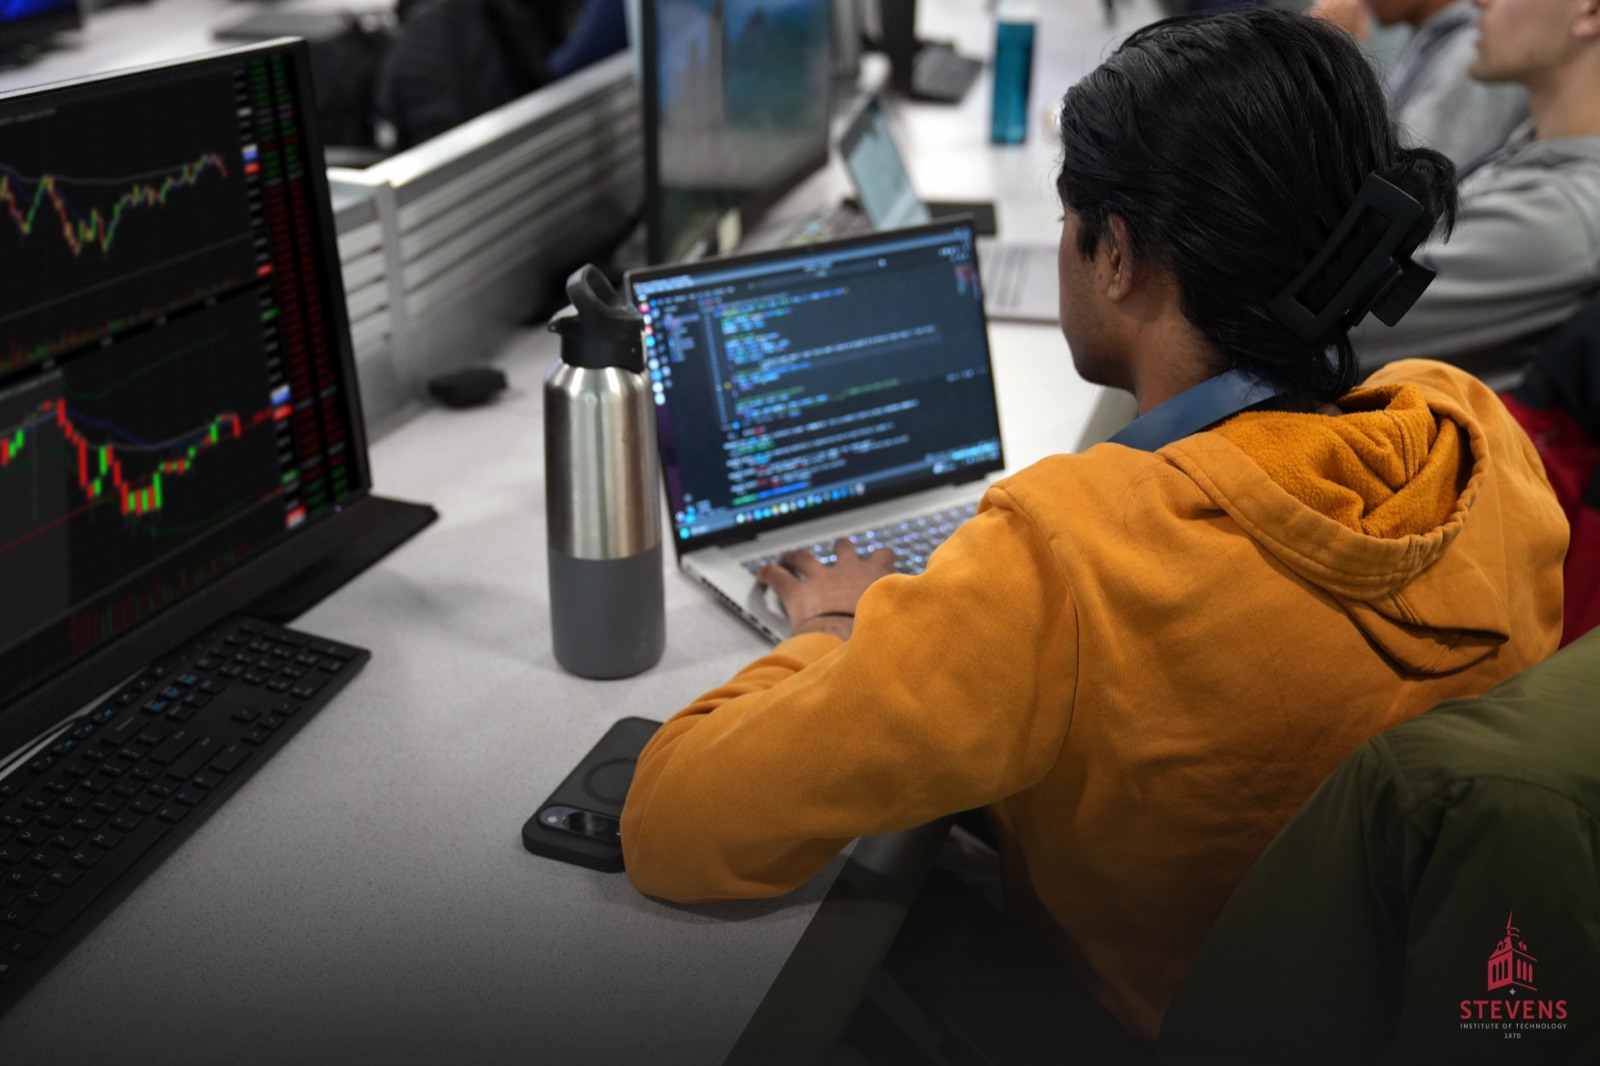
Each week, teams wrote Python strategies for a new market-condition theme and deployed them to the SHIFT exchange, where they were ranked by PnL.
“We had the best trade of the day. We just had no one to trade with.”
Final rankings
01First Place
Rutgers University
Yaning Wu · Elizabeth Pisakhova
Prize$2,000
02Second Place
Stevens Institute of Technology
Steven Khaw · Naranjan Lal · Rajesh Kumar
Prize$1,200
03Third Place
Stony Brook University
Mathew Sharma · Sidhanth Thapa · Jonathan Jia · Dan Liang
Prize$400
Case studies
How some of the standout teams approached the 2026 markets.
The Bagholders
Facing the Round 4 “correlation” theme, the team tested the intended relationship among three stocks (roughly CS1 ≈ 100 + β(CS2 − CS3), with β near 1.25) but judged classic statistical arbitrage too risky: 1-lot execution limits made precise hedging hard, and the legs diverged late in the day — an LTCM-style failure mode. Instead they built a trend-following algorithm from scratch, scoring each stock with 30- and 20-minute linear-regression signals (rewarding R², penalizing maximum drawdown) and rotating into the strongest trend. When the assumed correlation broke down in the final 90 minutes, the strategy captured the emerging trends and climbed the leaderboard.
Strategy snapshot
Stevens Quants
Recognizing that SHIFT sessions replay real historical dates, the team found that the get_last_trade_time() API call revealed the exact replay date before the opening bell. They pre-computed the largest movers for 5,595 historical dates, then locked in a long/short pair at the open (on its run, CVX long and UNH short), held through the day, and exited at the historically known intraday highs and lows. The strategy posted the session’s best realized P&L (about $16,538) and Sharpe (0.96), but was disqualified that round for missing the 200-fill minimum — with the market moving one way all day, no counterparties traded against its resting limit orders. The exploit prompted a change to the competition rules and back-end.
Strategy snapshot
get_last_trade_time() revealed the replay date; top movers pre-computed across 5,595 datesColumbia-traders
A directional market maker for three illiquid small-caps (SHOO, CROX, PZZA) that always quotes both sides of the book but skews placement by a real-time momentum regime. The signal sums the last 15 “tick deltas” (the signed direction of each price change): ten or more up is BULL, ten or more down is BEAR, otherwise NEUTRAL, with quotes leaning aggressive on the trending side and inventory capped at ±5 lots. By discarding price magnitude and timestamps entirely, the tick-delta signal stayed robust to the frozen-timestamp and tiny-return problems that break conventional intraday momentum signals in illiquid names.
Strategy snapshot