Researchers:
Anantha Balineni, Saboura Salari Rad, and Jesse Baron
Abstract:
This paper discusses the use of Generative Adversarial Networks (GANs) and copulas as powerful methods for generating synthetic data that can be used in various applications. The quality of synthetic data generated by these methods is important, and various metrics such as statistical moments, Jensen-Shannon divergence, Kolmogorov-Smirnov test, and Silhouette score can be used to evaluate its accuracy and similarity to the original data. The potential future applications of these methods and metrics include investigating the performance of these techniques during specific market cycles in financial datasets and exploring their effectiveness and generalizability in other industries.
Introduction:
Generating synthetic data is an essential part of data science. It involves creating a machine learning method that is given a dataset as input and generates synthetic data that is similar to the original dataset. When applied to financial markets, synthetic data can be used to backtest trading strategies in different market regimes. The main question we investigate in this paper is the following: how can we leverage machine learning methods to generate and identify realistic tail event scenarios in financial markets? There are two main components to this question that are important to identify. First, which machine learning methods are best to generate synthetic data? There are many different methods that can be implemented to generate synthetic data that will yield slightly different results. This paper will describe different machine learning methods, how they are constructed, and their outputs on different datasets.
Relevance to Financial Engineering:
The project explores the application of its findings across various industries, with a specific emphasis on financial engineering. Financial engineers aim to design investment strategies that outperform benchmarks, relying on backtesting for strategy development. However, a significant challenge in backtesting arises from the scarcity of historical data, especially for infrequent events like financial crises. The project addresses this challenge by investigating methods and metrics to generate synthetic data, offering financial engineers an alternative for more accurate backtesting. Synthetic data also presents privacy advantages, allowing organizations to share data without disclosing sensitive information. Despite the benefits, challenges include the time-consuming process of developing accurate synthetic data algorithms and ensuring its reliability for backtesting, a concern addressed by the project through key metrics.
Literature Review:
The literature review delves into research on data augmentation and scenario generation in financial markets, drawing from key articles that provided valuable insights. Chalongvorachai and Woraratpanya's work introduces a data generation framework for extremely rare case signals, employing signal comparison techniques and quality classifiers to ensure output data quality. Czado, Claudia, and Nagler's study on Vine Copula Based Modeling explores the concept of vine copulas, addressing limitations of traditional copulas related to symmetry and tail dependence. This influenced the decision to utilize vine copulas in synthetic data generation. Another method explored is based on Bhatia, Jain, and Hooi's ExGAN, focusing on generative adversarial networks for synthesizing extreme samples efficiently in constant time. Lastly, Lei Xu, Maria Skoularidou, Alfredo Cuesta-Infante, and Kalyan Veeramachaneni's work on Modeling Tabular Data using Conditional GAN informs the understanding of using CTGAN for modeling and testing the quality of tabular.
Generative Adversarial Networks (GANs): In the exploration of machine learning methods, the research delved into Generative Adversarial Networks (GANs), a widely employed technique for generative modeling using deep learning. GANs automatically discern patterns in input data, generating output data that closely resembles the original dataset. The model comprises two sub-models: the generator, which produces synthetic data based on the input, and the discriminator, tasked with distinguishing between real and synthetic samples. Both models are trained concurrently until the discriminator is fooled approximately half the time, signifying the generator's proficiency in creating realistic samples. The appeal of GANs lies in the collaborative training of these two models, leading to continuous improvement. The research included two GAN variations: Conditional Tabular GAN (CTGAN) and DoppleGanger GAN (DGAN), each tailored for specific synthetic data generation purposes.
CTGAN (Conditional Tabular GAN) : CTGAN (Conditional Tabular GAN) functions as a machine learning algorithm designed for synthesizing tabular data. It operates on the generative adversarial network (GAN) architecture, which consists of two neural networks: a generator and a discriminator. Unlike a traditional GAN, CTGAN has the ability to be conditioned. The "conditional" aspect of CTGAN signifies its capability to be conditioned on specific features of real data. This means that the algorithm can learn to generate synthetic data with similar distributions for certain subsets of features. CTGAN proves to be a valuable tool for various applications, including data augmentation, data privacy, and data analysis. Its capacity to generate synthetic data addresses challenges such as data scarcity, data imbalance, and privacy concerns, while also offering insights into the underlying distributions of real data.
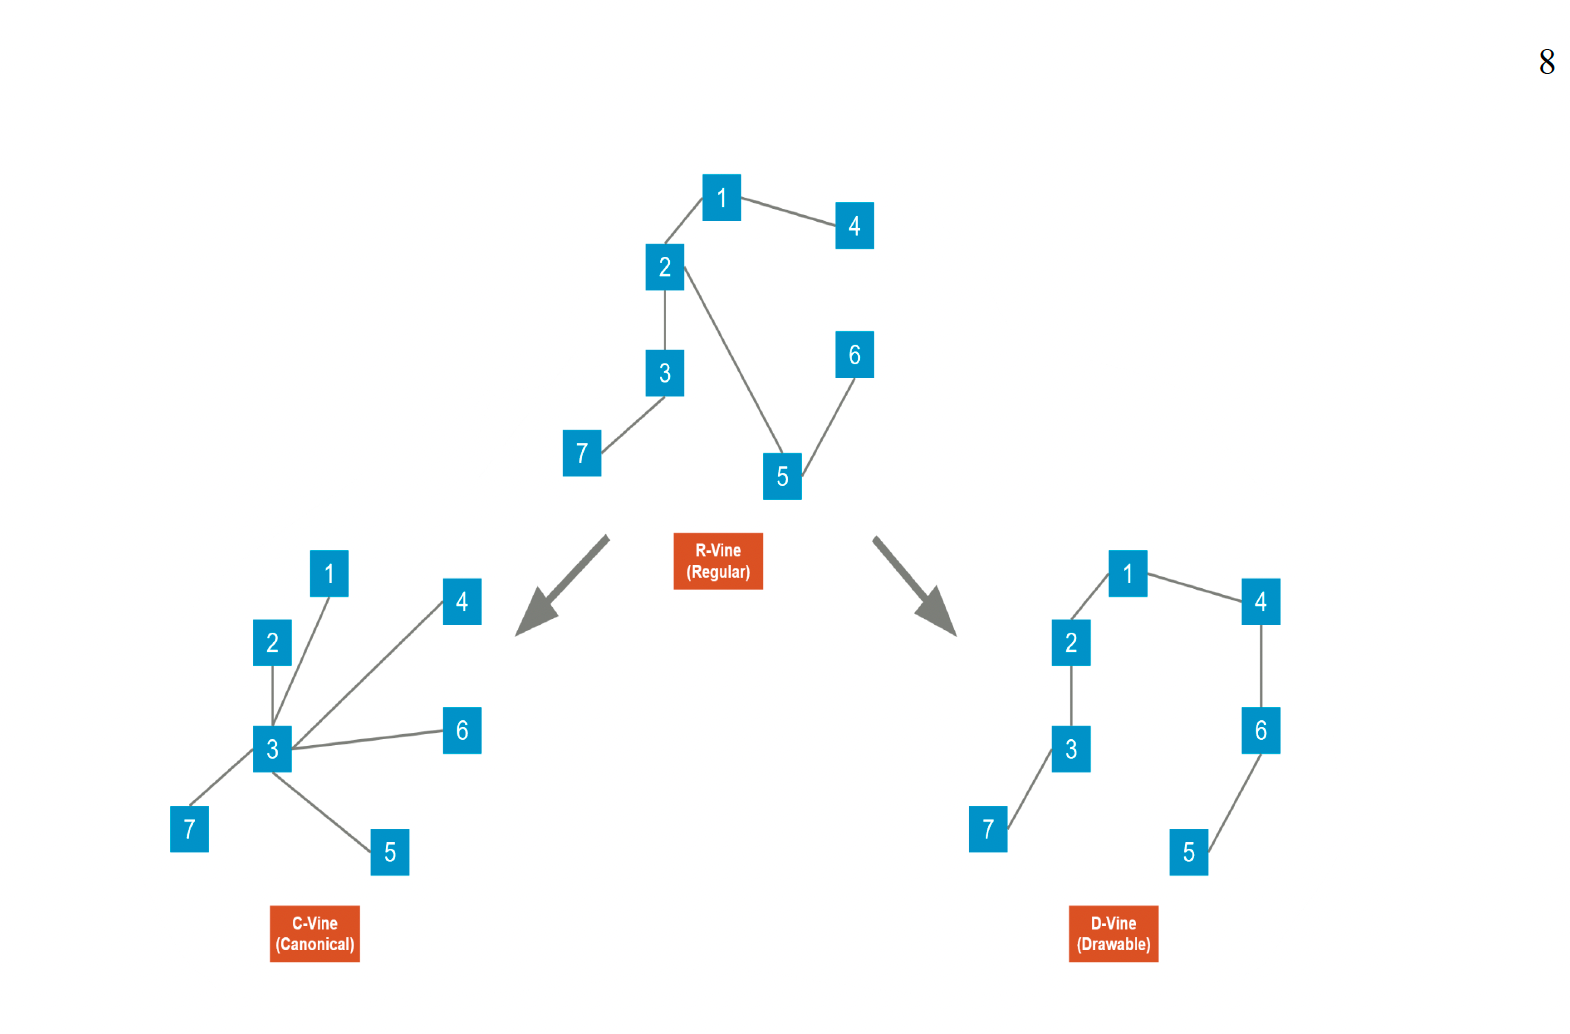
Copula: The second machine learning method employed for synthetic data generation is the copula approach. This entails a probability model featuring a uniform distribution that explores the relationships between multiple variables. The copula approach enables the construction of marginal models for each variable independently, which are then combined with a dependence structure characterized by a copula capable of modeling extreme endpoints. This method proves beneficial for identifying correlations observed in diverse types of data. Similar to Generative Adversarial Networks (GANs), there exist various types of copulas that can be constructed. Four types explored in our investigation include the Gaussian Copula, R-Vine Copula (Regular), C-Vine Copula (Canonical), and D-Vine Copula (Drawable). The Gaussian Copula, though linear, has constraints related to symmetry and tail dependence properties. However, Vine Copulas, such as R-Vine, C-Vine, and D-Vine, overcome these limitations by decomposing the high-dimensional Probability Density Function (PDF) into bivariate copulas and marginal densities. The graphic below illustrates the distinctions between the different Vine Copulas:
Datasets:
The research employed five datasets sourced from the Bloomberg Terminal, namely the Bloomberg Barclays Municipal Bond Index Total Return Index Value Unhedged USD, SPX Index, iShares Russell Top 200 ETF, MSCI USA Sector Neutral Quality Index, and MSCI All Countries World Index. The dataset spans from December 1999 to February 2023, covering 5,837 trading days. This extensive time frame enables a comprehensive comparison of metrics across diverse financial datasets, providing a more accurate assessment of the optimal methods and metrics.
Implementation:
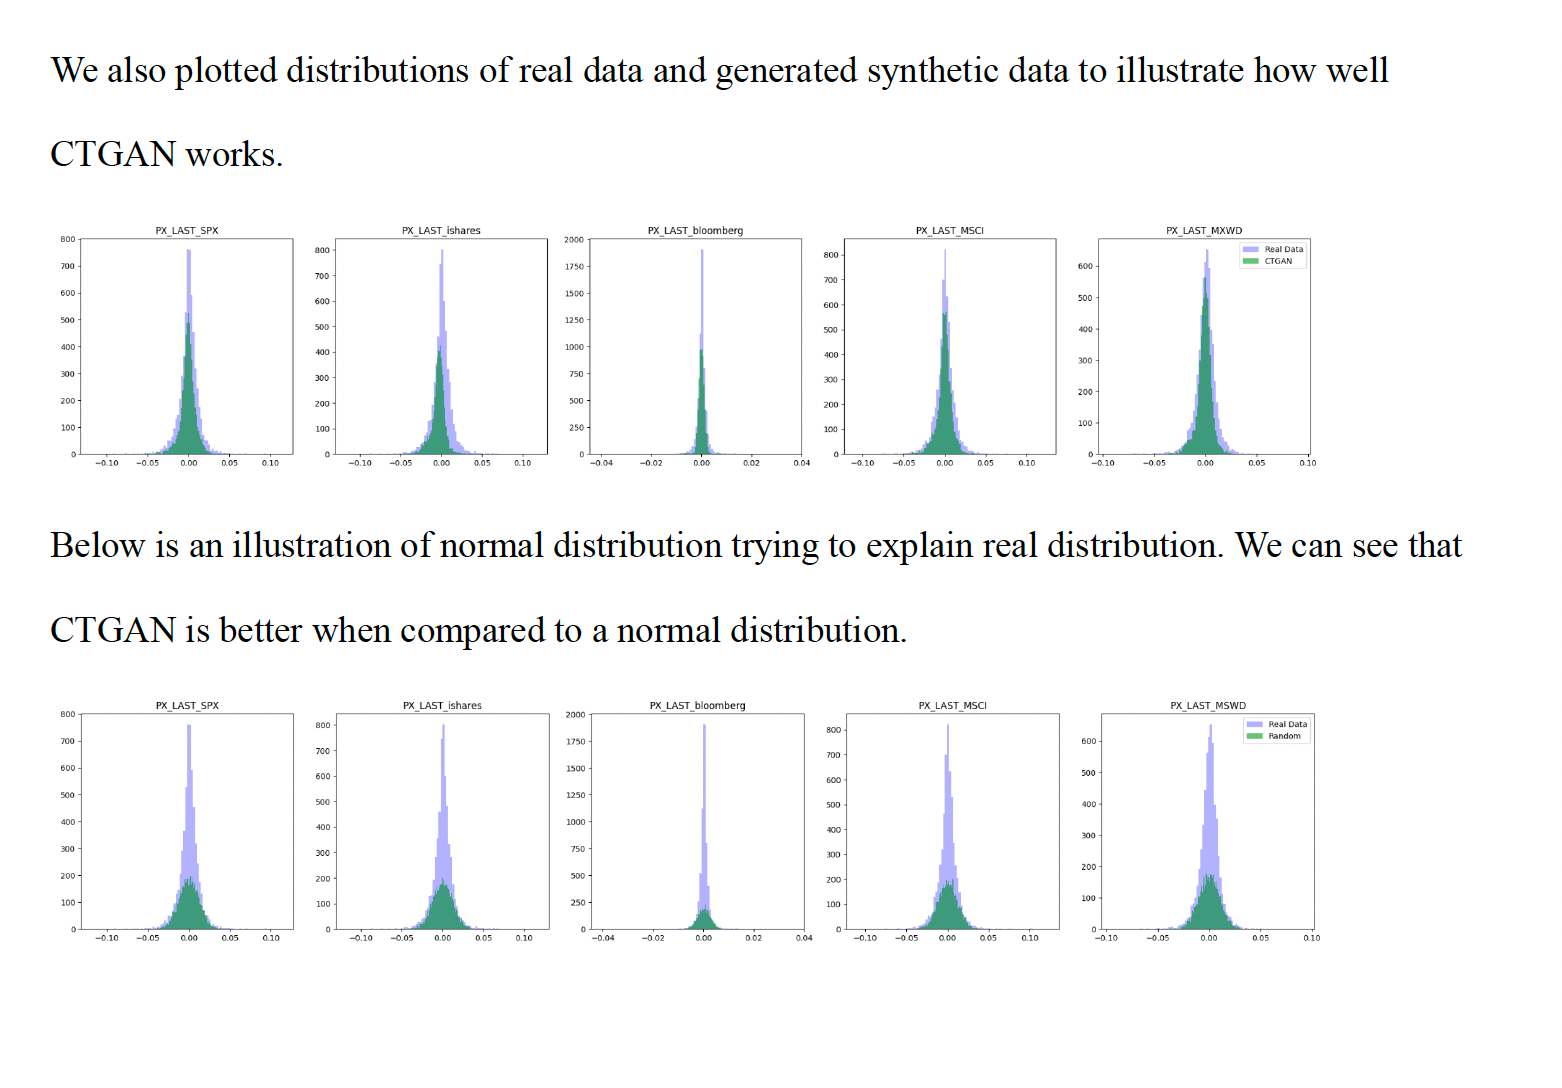
CTGAN Implementation:
Import CTGAN function from ctgan package and pass the CTGAN function on the dataset constituting 5 indices and choose 200 iterations. Important step is to not include timestamps in the dataset. Here, we are only trying to replicate distributions. Bear in mind when using the standalone CTGAN library that we need to manually preprocess your data into the correct format, below are some guidelines.
1. Continuous data must be represented as floats
2. Discrete data must be represented as ints or strings
3. The data should not contain any missing values
As compared to other methods, implementing ctgan is easy. Once 200 iterations complete, we store the synthetic dataset and compute mean, standard deviation, skewness and kurtosis.
Copulas Implementation:
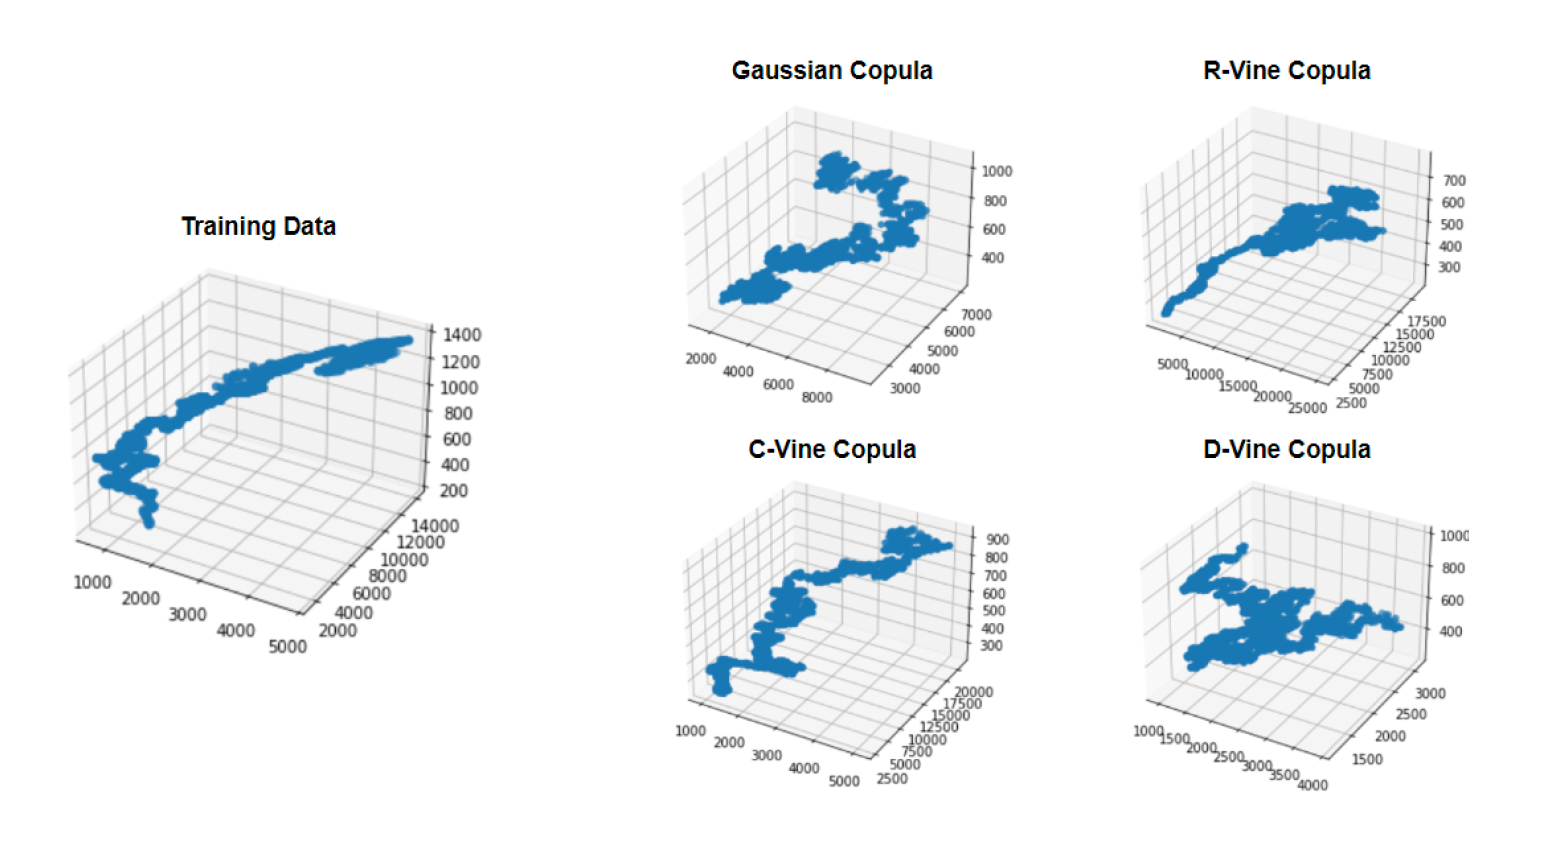
Each graph above contains data from three of the datasets in our sample. It is clear that R-Vine Copula and C-Vine Copula are the most similar to the actual data (training data). They better capture the shape of the distribution. It is expected that the Gaussian Copula would not be accurate since it has many limitations we previously discussed. However, it was not as obvious that D-Vine Copula would also generate poor synthetic data relative to the training data. One explanation for this could be that since each point is only connected to the previous and next point in the system it is more similar to the linear makeup of the Gaussian Copula.

After analyzing these outcomes for all five datasets, R-Vine Copula was the best method to further investigate and compare to the results of CTGAN.
RESULTS:
After identifying CTGAN and R-Vine Copula as the two most effective machine learning techniques for generating synthetic data, a crucial step involves comparing these approaches using specific metrics. These metrics play a vital role in synthetic data generation, offering quantitative insights into the accuracy and credibility of the generated data in comparison to real historical data. Accuracy is paramount, as inaccurate machine learning methods can lead to unreliable synthetic data, potentially yielding misleading conclusions and undermining any backtesting strategy. The comparison between these two methods involves five main metrics: risk assessment, statistical moments, Jensen-Shannon Divergence, Kolmogorov–Smirnov Test, and Silhouette Score.
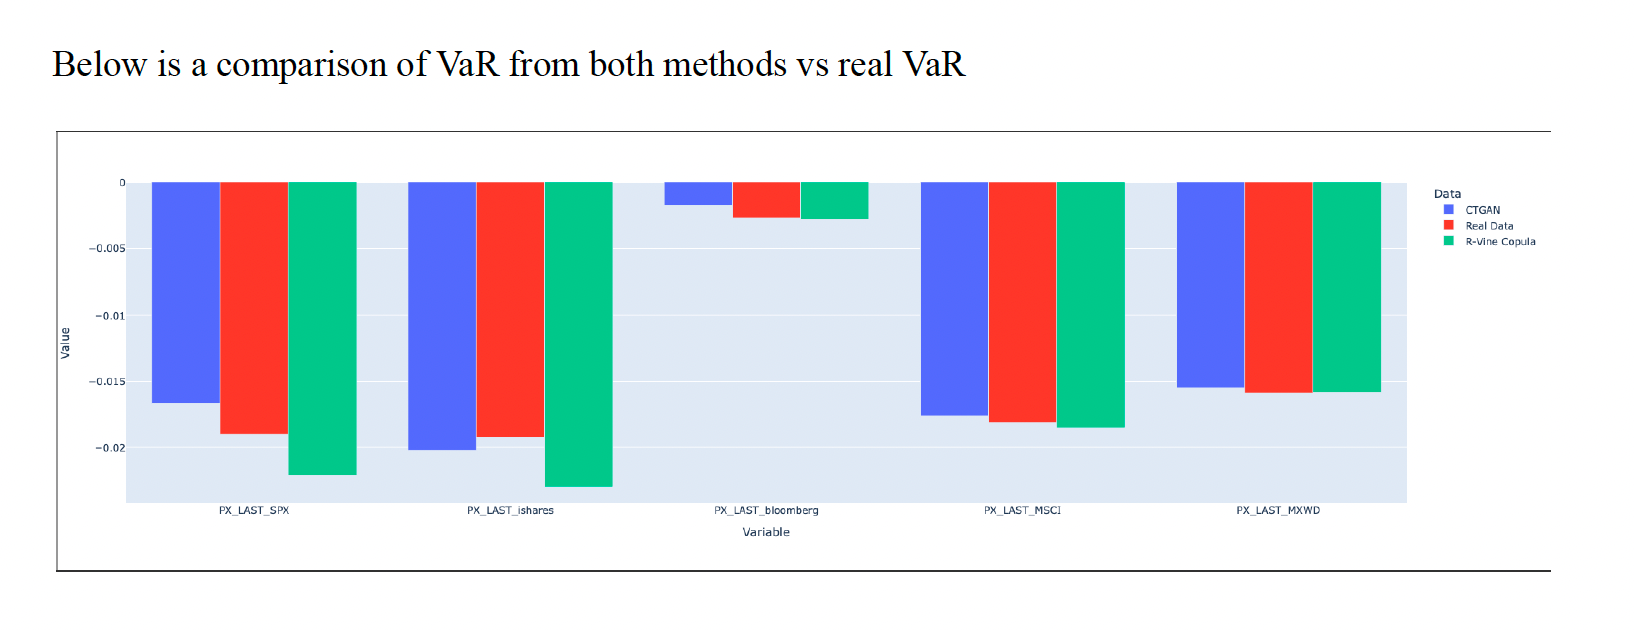
Risk Assessment:
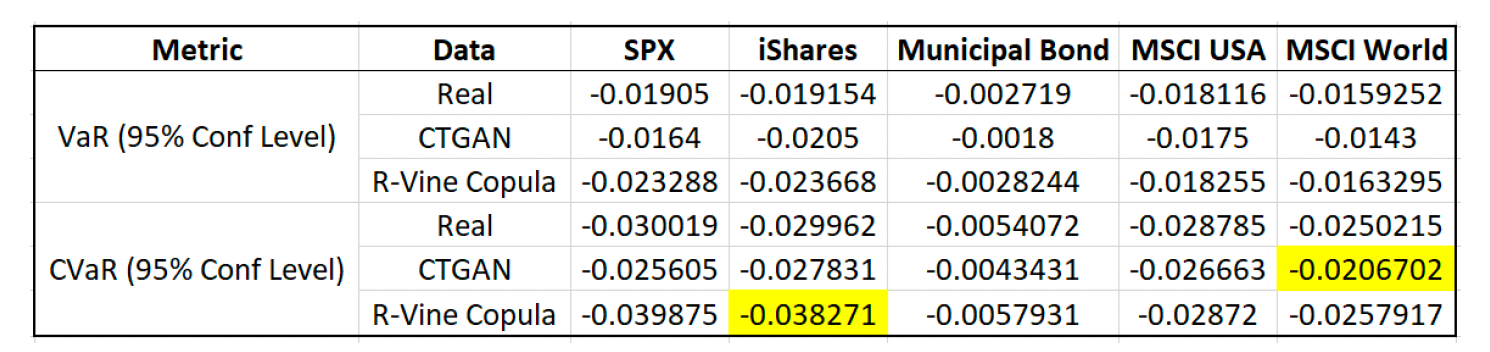
The best values to look at when assessing risk are the Value-at-Risk (VaR) and the Conditional Value-at-Risk (CVaR) of the generated datasets compared to the original dataset. We chose to look at the VaR and CVaR with a 95% confidence interval. Both CTAGN and R-Vine Copula appear to have very similar VaR and CVaR when compared to the real data. One important note is that CTGAN seems to underestimate the Conditional Value-at-Risk while R-Vine Copula seems to overestimate the Conditional Value-at-Risk. However, these discrepancies are very small and are still of the correct order of magnitude so it does not discount the accuracy of the risk assessment.
Statistical Moments:

Based on the above table, there were some commonalities and some differences between the methods. For example, the mean for the SPX was fairly consistent but the mean for the MSCI World Index for both CTGAN and R-Vine Copula were an order of magnitude different from the mean of the real data. This could be a result of the differences between the datasets or an issue with the methods. Standard deviation is very consistent for all methods and across all datasets. Skewness is not very accurate since the CTGAN data is an order of magnitude different from the real data and the R-Vine Copula data. Finally, for the fourth moment (kurtosis), there seems to be mixed signals depending on the dataset which is similar to the means. Overall, standard deviation is the most accurate statistical moment across all datasets while the other moments were not as similar.
Jensen-Shannon Divergence:
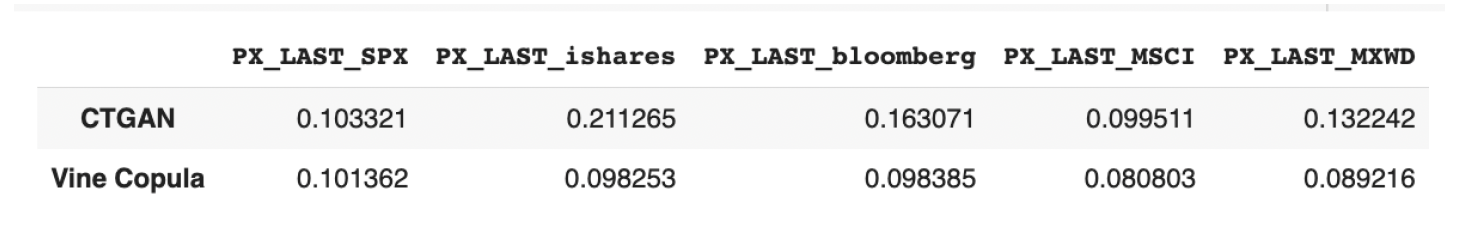
The Jensen-Shannon Divergence is a statistical measure of the similarity between two probability distributions. It is a symmetric and smoothed version of Kullback-Leibler Divergence and is bounded between 0 and 1, where 0 indicates that the two distributions are identical, and 1 indicates that they are completely different. The highest value for CTGAN is 0.21 and the lowest value is 0.10. This is exactly what we expect to see since the goal is for the distributions to be very similar to the real data. If the Jensen-Shannon Divergence value was closer to 1 than the synthetic data that was generated would not be useful. The values for R-Vine Copula give an even better result: the highest value is 0.10 while the lowest value is 0.08. While both CTGAN and R-Vine Copula reported very low values, R-Vine Copula is slightly more similar to the real data based on the Jensen-Shannon Divergence.
Kolmogorov-Smirnov Test:
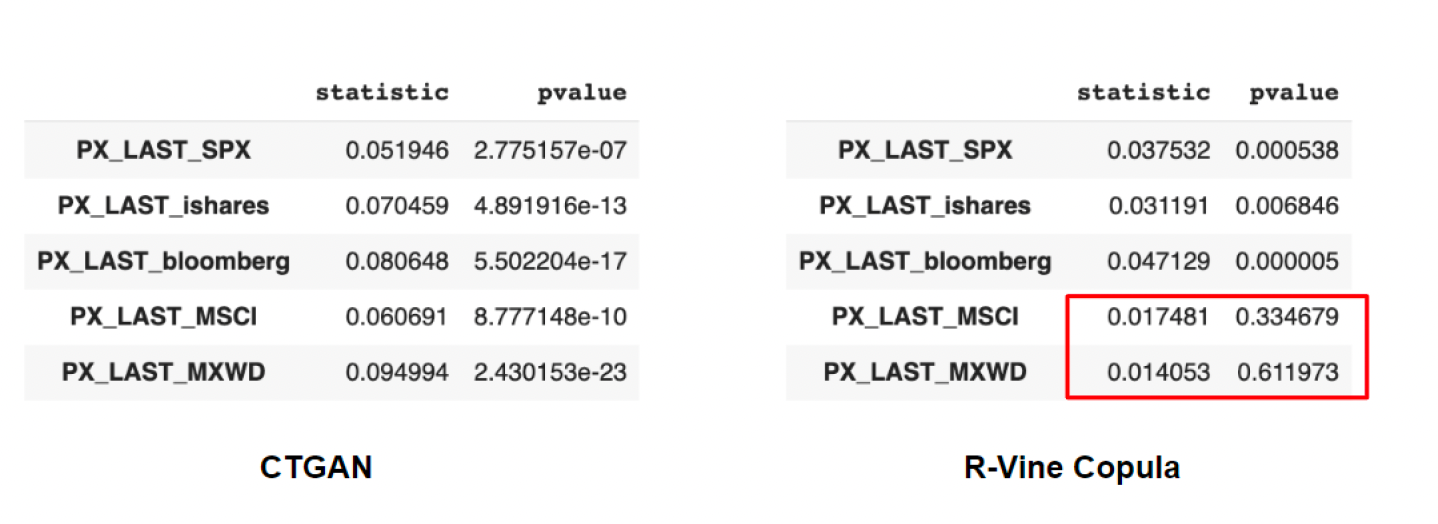
The Kolmogorov-Smirnov (K-S) test is a goodness-of-fit test used to compare two probability distributions. Almost all of the p-values are statistically significant, meaning the test succeeded for most cases. The only results that indicate a failure of the test are the R-Vine Copula results for the MSCI USA and MSCI World indices. These p-values are over 0.05 which indicates that the deviation from the null hypothesis is not statistically significant, and the null hypothesis is not rejected.
Silhouette Score:

The silhouette score is a measure of how well each cluster is defined and is used for clustering tasks when the true labels are unknown.. The clusters are most clearly defined when the silhouette score is 1 - a score of 0 means that the data points are on the border between two clusters and could be assigned to either. The silhouette score takes into account both the within-cluster distance and the between-cluster distance of each data point, and then calculates an average score for all data points in the dataset. We calculated the silhouette scores for both returns and prices. The scores were higher for the prices and lower for the returns which indicates that there are more well-defined clusters in the prices datasets. This makes sense since returns are all different percentages while prices are relatively close to one another from one time period to the next. It is expected for there to be more defined clusters for pricing data than returns data.
Conclusion:
In summary, GANs and copulas emerge as potent machine learning approaches for synthesizing data, finding utility in diverse applications like data augmentation, privacy, and analysis. The accuracy of the generated synthetic data holds paramount importance, with its evaluation achievable through diverse metrics. Crucial metrics such as statistical moments, Jensen-Shannon divergence, Kolmogorov-Smirnov test, and Silhouette score serve as vital tools for assessing the quality and similarity between synthetic and original data. By leveraging these metrics, we ensure the synthetic data adheres to high standards, meeting necessary prerequisites for downstream applications. Looking ahead, the future applications of these methods and metrics extend to isolating specific time periods within financial datasets, exploring their performance variations across distinct market cycles. Furthermore, the applicability of these techniques extends beyond finance, with potential applications in other industries for testing effectiveness and generalizability. In conclusion, the synergistic use of GANs, copulas, and appropriate metrics presents a robust approach for generating synthetic data that faithfully represents the distribution of the original data.