A "static" visualization example
Structure of the Volatility Database

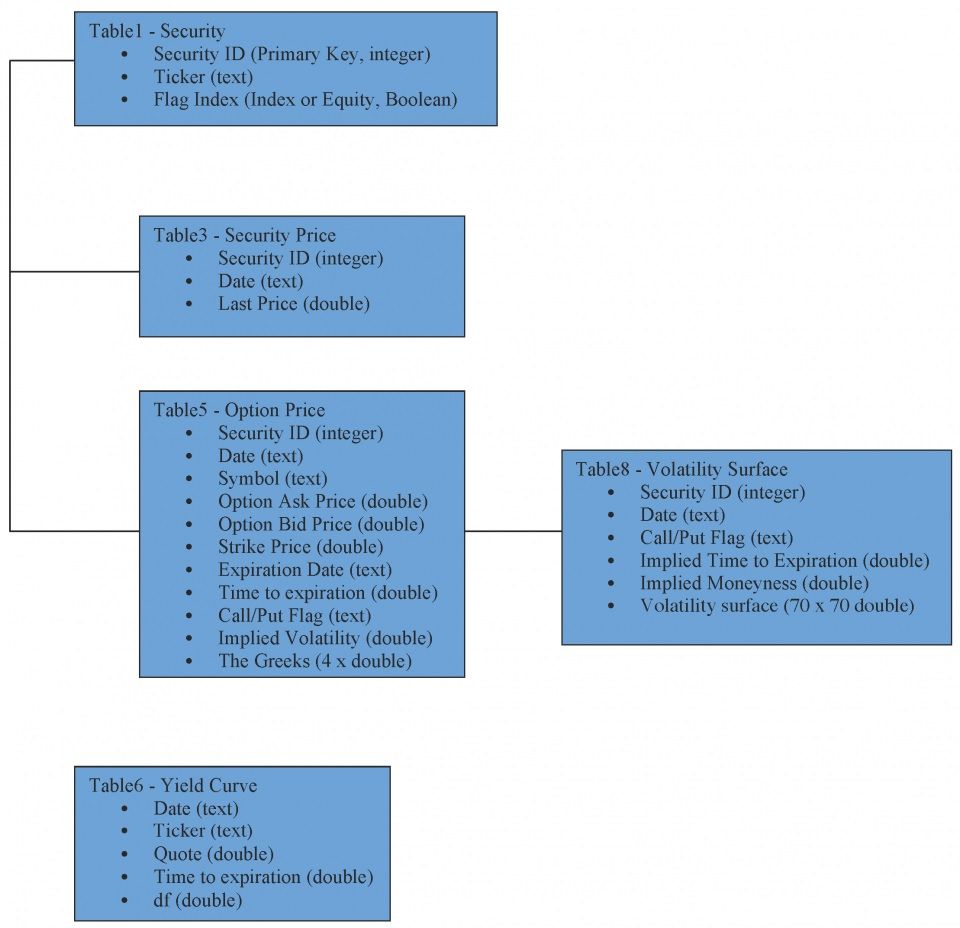
The figure gives the structure of the Volatility Database. It currently contains 5 tables, among which four are connected via the Security ID, a primary key in Table 1 (Security).
In Table 1 (Security) we store the securities' ticker (as used by Bloomberg), and the flag index (if the security is an index, the flag is true; for an equity, the flag is false). In Table 3 (Security price) we store the closing price (daily values) for the Security specified by Security ID. Table 5 (option Price) stores all the information needed to compute the Implied Volatility. An interest rate yield curve is stored in Table 6 (Yield Curve). The curve is constructed using interpolated values from interest rate products. Table 8 contains all the necessary information for drawing the volatility surface on a different platform (for example, on a web page).
Sample Surfaces
Purpose of the Volatility Database
The purpose of the Volatility Database is to provide valuable data, and quality analytical tools and algorithms of financial data for universities, traders, banks, hedge funds, etc. Currently, the database contains:
- Implied volatility data for various equity and index options markets
- Smooth volatility surface via a Gaussian kernel
- Yield curve
Dynamic visualization is available here.
Project Members
- Sebastian Tudor, PhD student in Financial Engineering, studor@stevens.edu
- Honglei Zhao, PhD student in Financial Engineering, hzhao10@stevens.edu
- Minzhe Liu, Master student in Financial Engineering, mliu13@stevens.edu
Main Tools Used
- Data Provider: Bloomberg
- Computations: R and Matlab
- Database system: PostgreSQL
- Web design: PHP, JavaScript, HTML
